Your field data lives in forms, tasks, and reports, but getting a complete picture of operations means jumping between multiple views, manually compiling the data, and losing time before decisions can be made.
With Fluix Dashboards, you can eliminate this. It’s your One Source of Truth for Field Data. You can consolidate field activity data into a centralized reporting hub, ensuring data consistency, maintaining data integrity, and keeping every team aligned on the same data.
In Dashboard, you can also track progress on ongoing work, monitor the site team’s activity, and take action if something is delayed or goes wrong.
What tasks does Dashboard solve?
The primary advantage of this functionality is that it empowers Admins with a project management and reporting tool. Explore a detailed overview of this feature below.
Identify Patterns & Analyze Incidents. Spot recurring issues, seasonal peaks, or inefficiencies hidden in raw field data. Visualize issue types, frequencies, and severities to prioritize corrective actions before issues escalate.
Data Compilation and Filtering. Use the Last Action Period picker to quickly search and filter data in your account. This will also help you better understand the status of various projects or tasks your team is involved in, providing an in-depth analysis of overall team performance.
Real Time Data. Every time a field team submits a form, your dashboard updates automatically. You’ll see a live view of operations as they happen. In addition, you can check the process history, track task completion times, download the forms submitted for the task, troubleshoot, or take action as needed.
Dedicated Views for Every Team and Project. Save separate dashboards tailored to specific projects, processes, or audiences, so project managers, safety leads, and executives can see exactly what they need, without the noise.
Visualize Data Captured In The Field. Build dashboards with filtered data from the forms and tasks your field team fills out on site, and instantly visualize it in the Charts.
Sharing Data with Your Team. Dashboard offers a simple way to share default or customized reports to improve communication with stakeholders, team, & leadership by sharing separate charts for reviews, POCs, and reporting cycles.
Managing Active Processes and Task Assignments.
Reassigning Tasks to Other Team Members. Specific tasks within the Templates or In Progress stages can be reassigned to the group responsible for their completion or to an individual within that group. This action is typically taken when a task assigned to a specific user is affected by circumstances that prevent them from completing it (e.g., illness, absence).
Suspending and Resuming the Process. You can temporarily suspend and resume specific processes for all users as required. These actions may be beneficial when you need to temporarily pause ongoing processes to await final responses or decisions pertaining to deals.
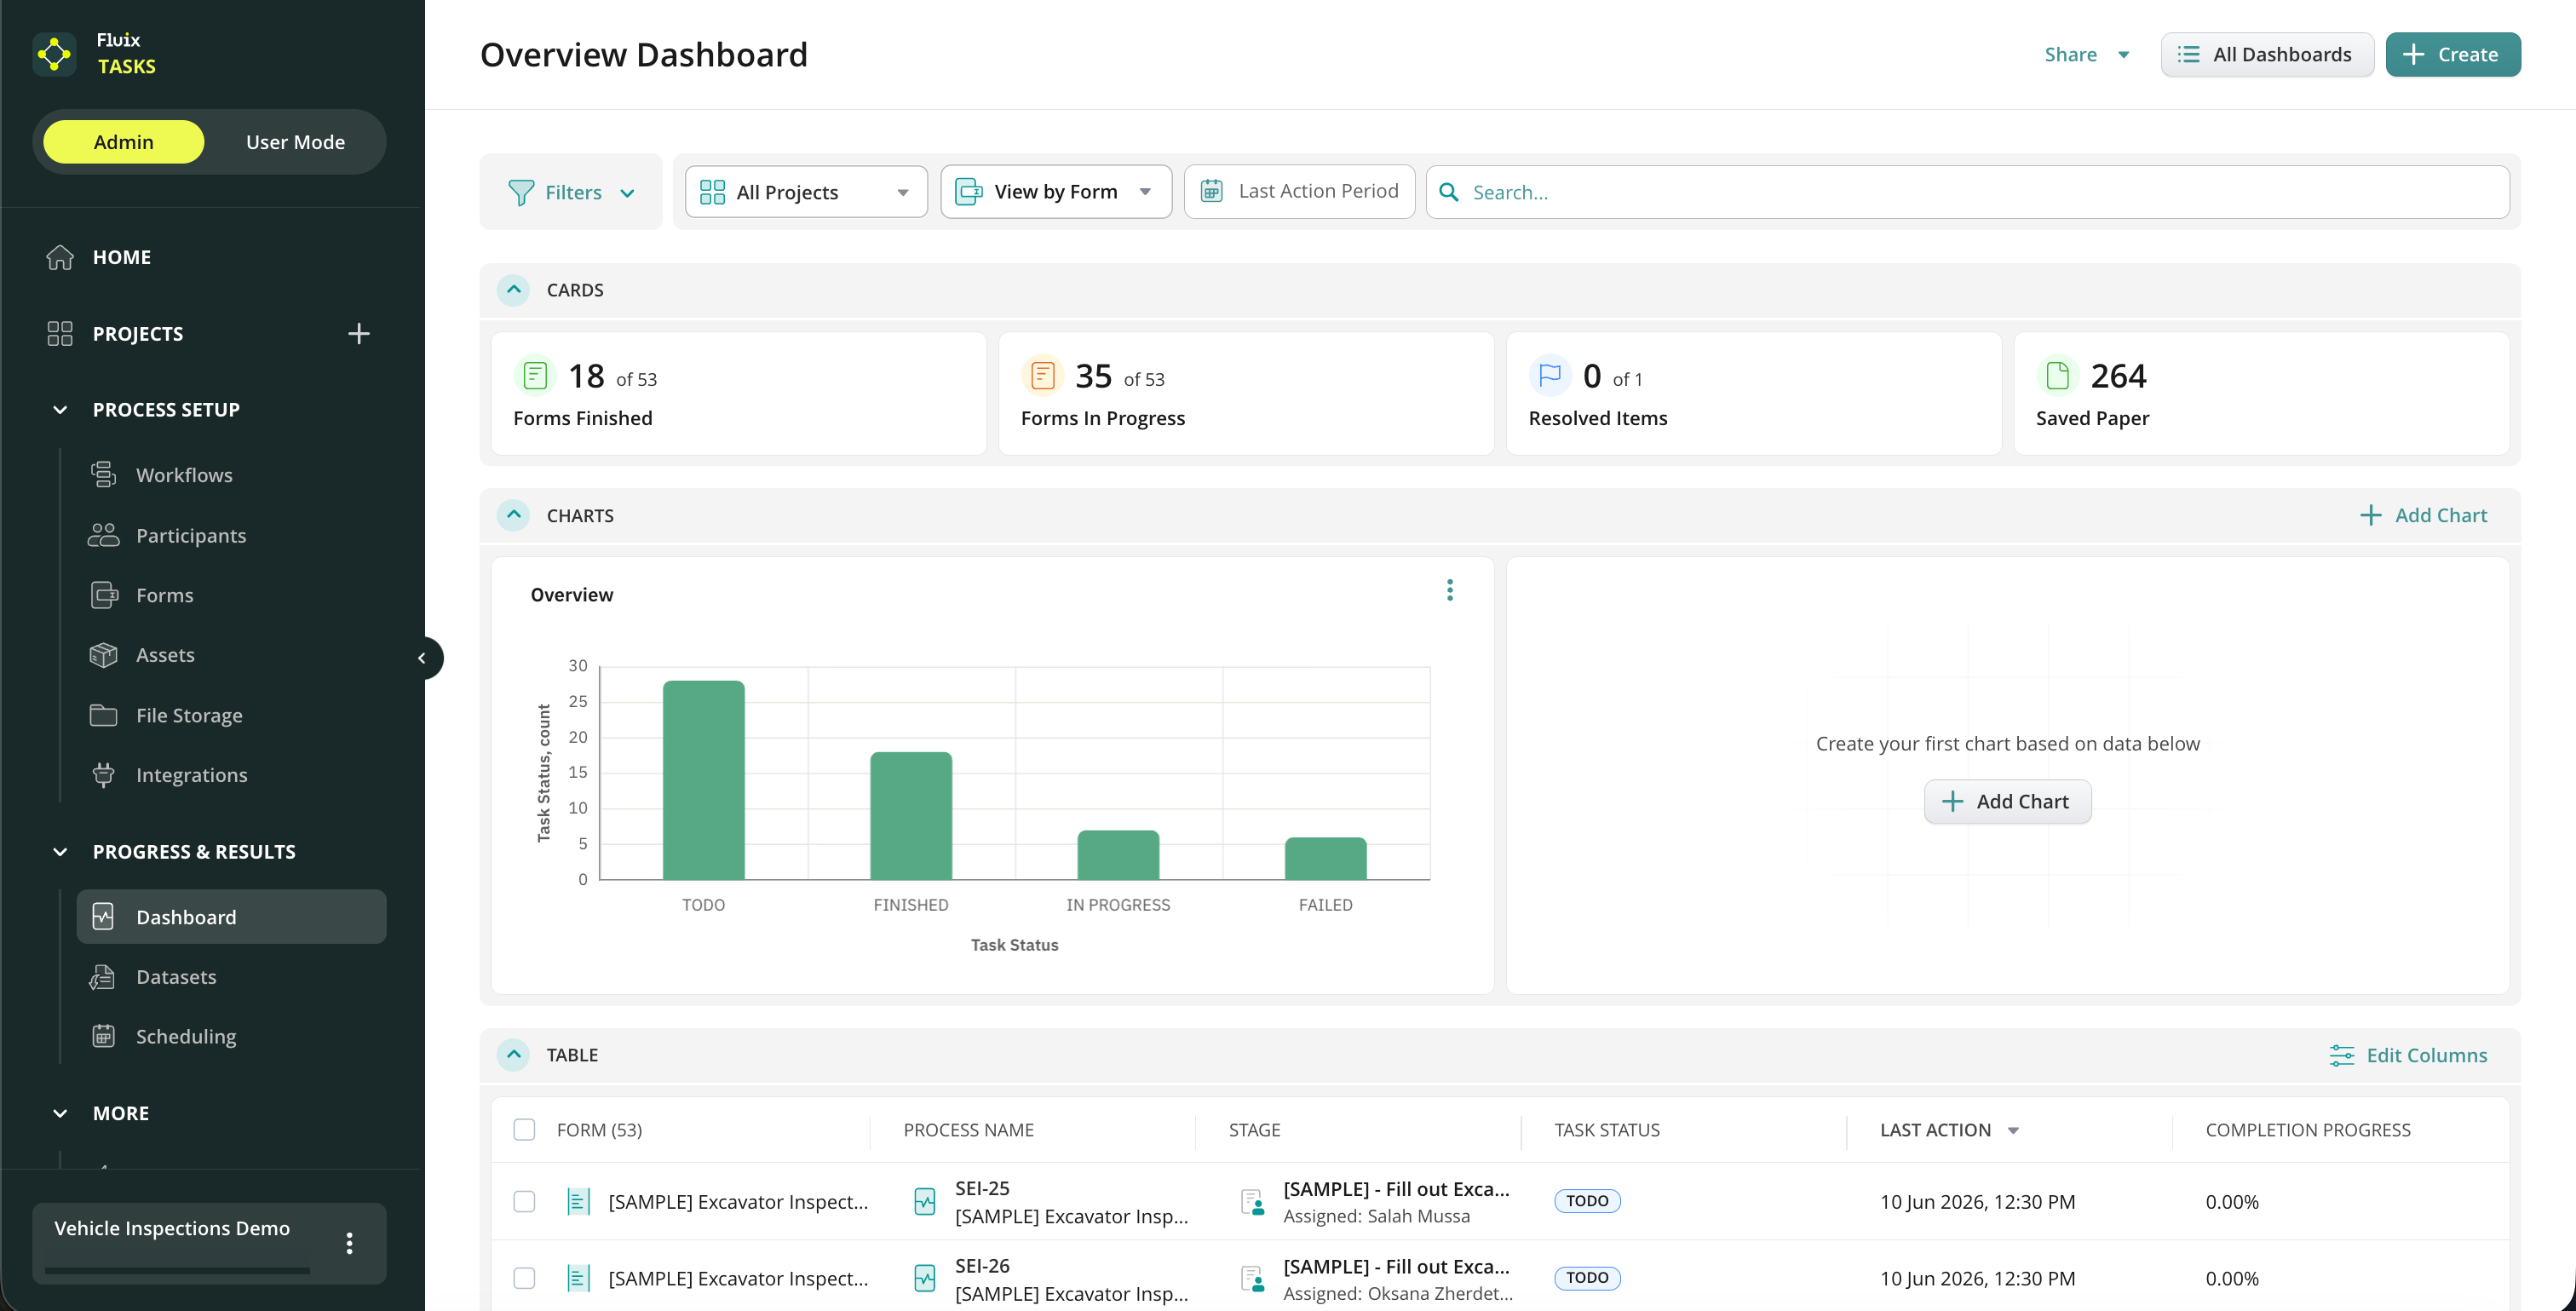
Dashboard overview
By default, the Dashboard section shows the current state of your account’s processes. In this scenario, data will be filtered to show processes from all workflows in your account. This section contains the following information by default:
Process. The process ID and the name of the Workflow where this process was initially started. The ID contains the first letters of the Workflow name and numbers.
Stage. The name of the form’s current task and assignee information (group/user name/guest name).
Task Status. The status of the current tasks from the process (in case there are parallel tasks, a few statuses will be displayed at the same time):
ToDo. The task was assigned to a group and is not in progress.
In Progress. One of the users from the group took the task.
Finished. All tasks from the Workflow were finished.
Failed. One of the service tasks has failed (upload to folder/send by email).
Overdue. The Due time has expired.
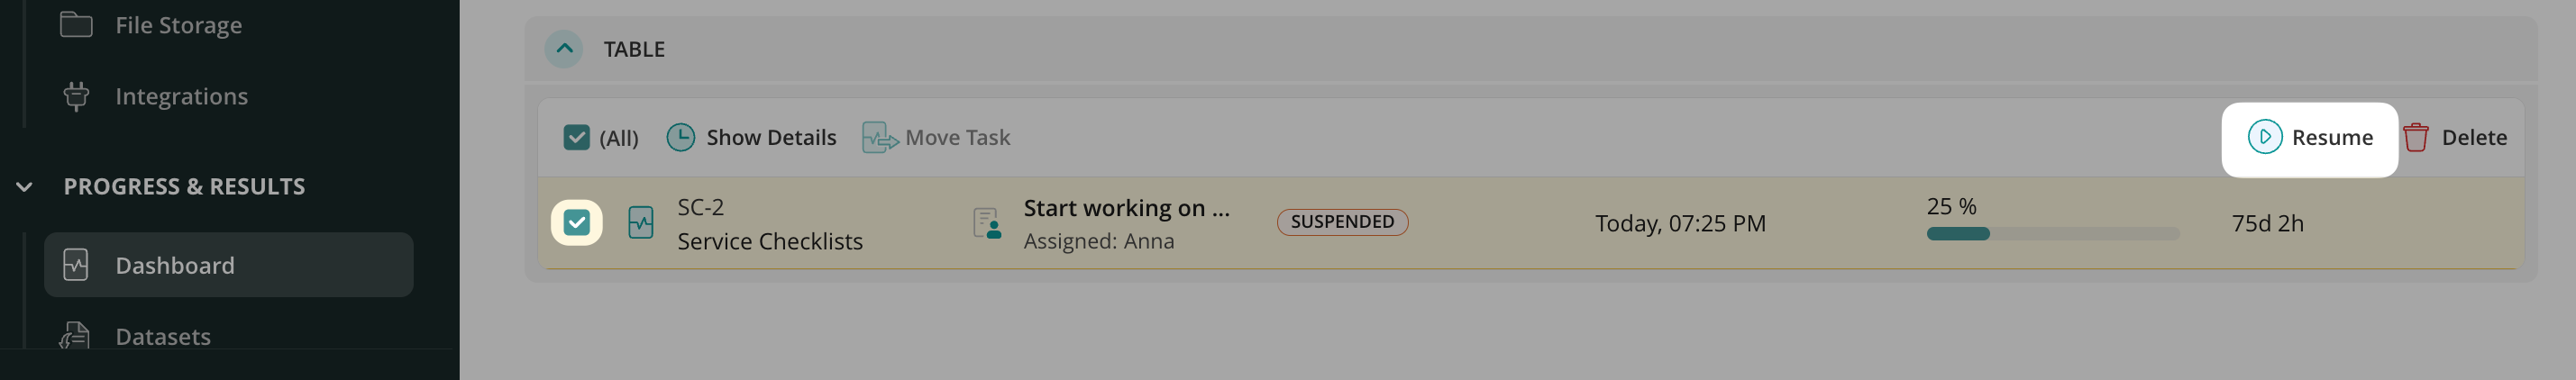
Suspended. The Admin temporarily paused the process. In such cases, the tasks disappear from users’ User app and reappear when the Admin resumes the process by selecting them and clicking the “Resume” button in the Dashboard section.
Last Action. The latest time when there was any action on the chosen task.
Completion Progress. The indicator, in percentages, to easily track completion progress within the form.
Customizing Dashboard
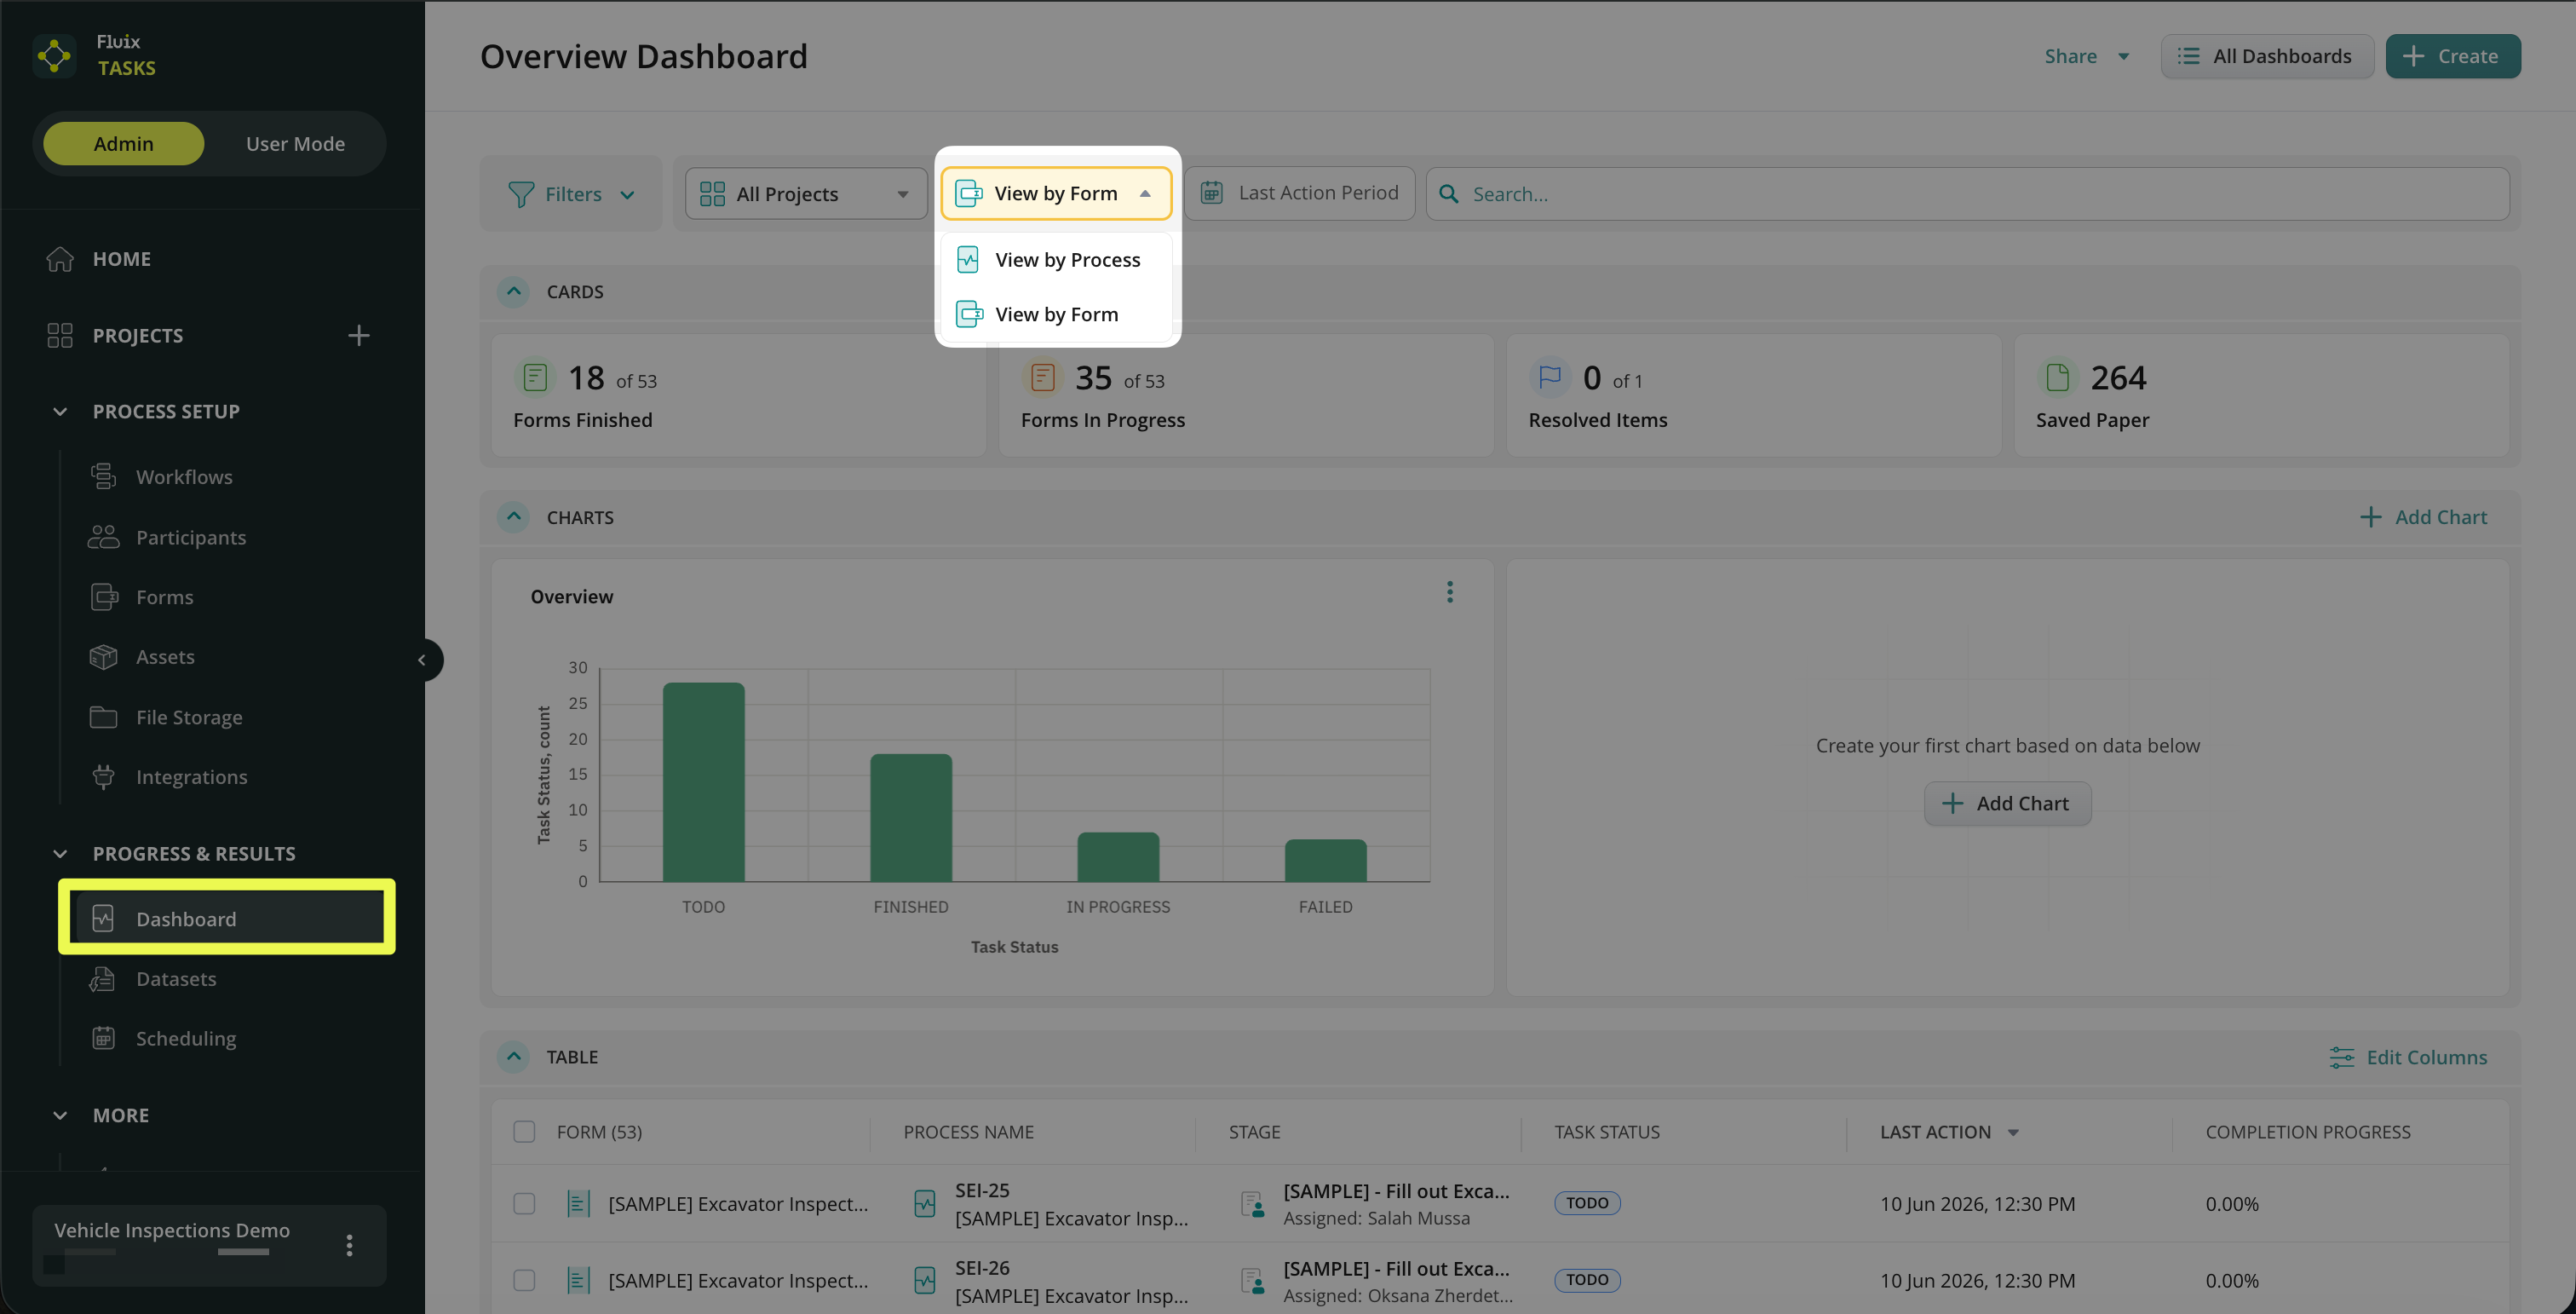
You may customize the Dashboard view by adding specific columns and deleting unnecessary ones. For example, you may change the view type of the data in the Dashboard by:
By Process – to check the data based on the whole process that your team is working on;
By Form – to track actions done with the form configured in the respective workflow. It also gives you an additional angle of view to monitor progress on forms and identify bottlenecks or other issues in a timely manner.
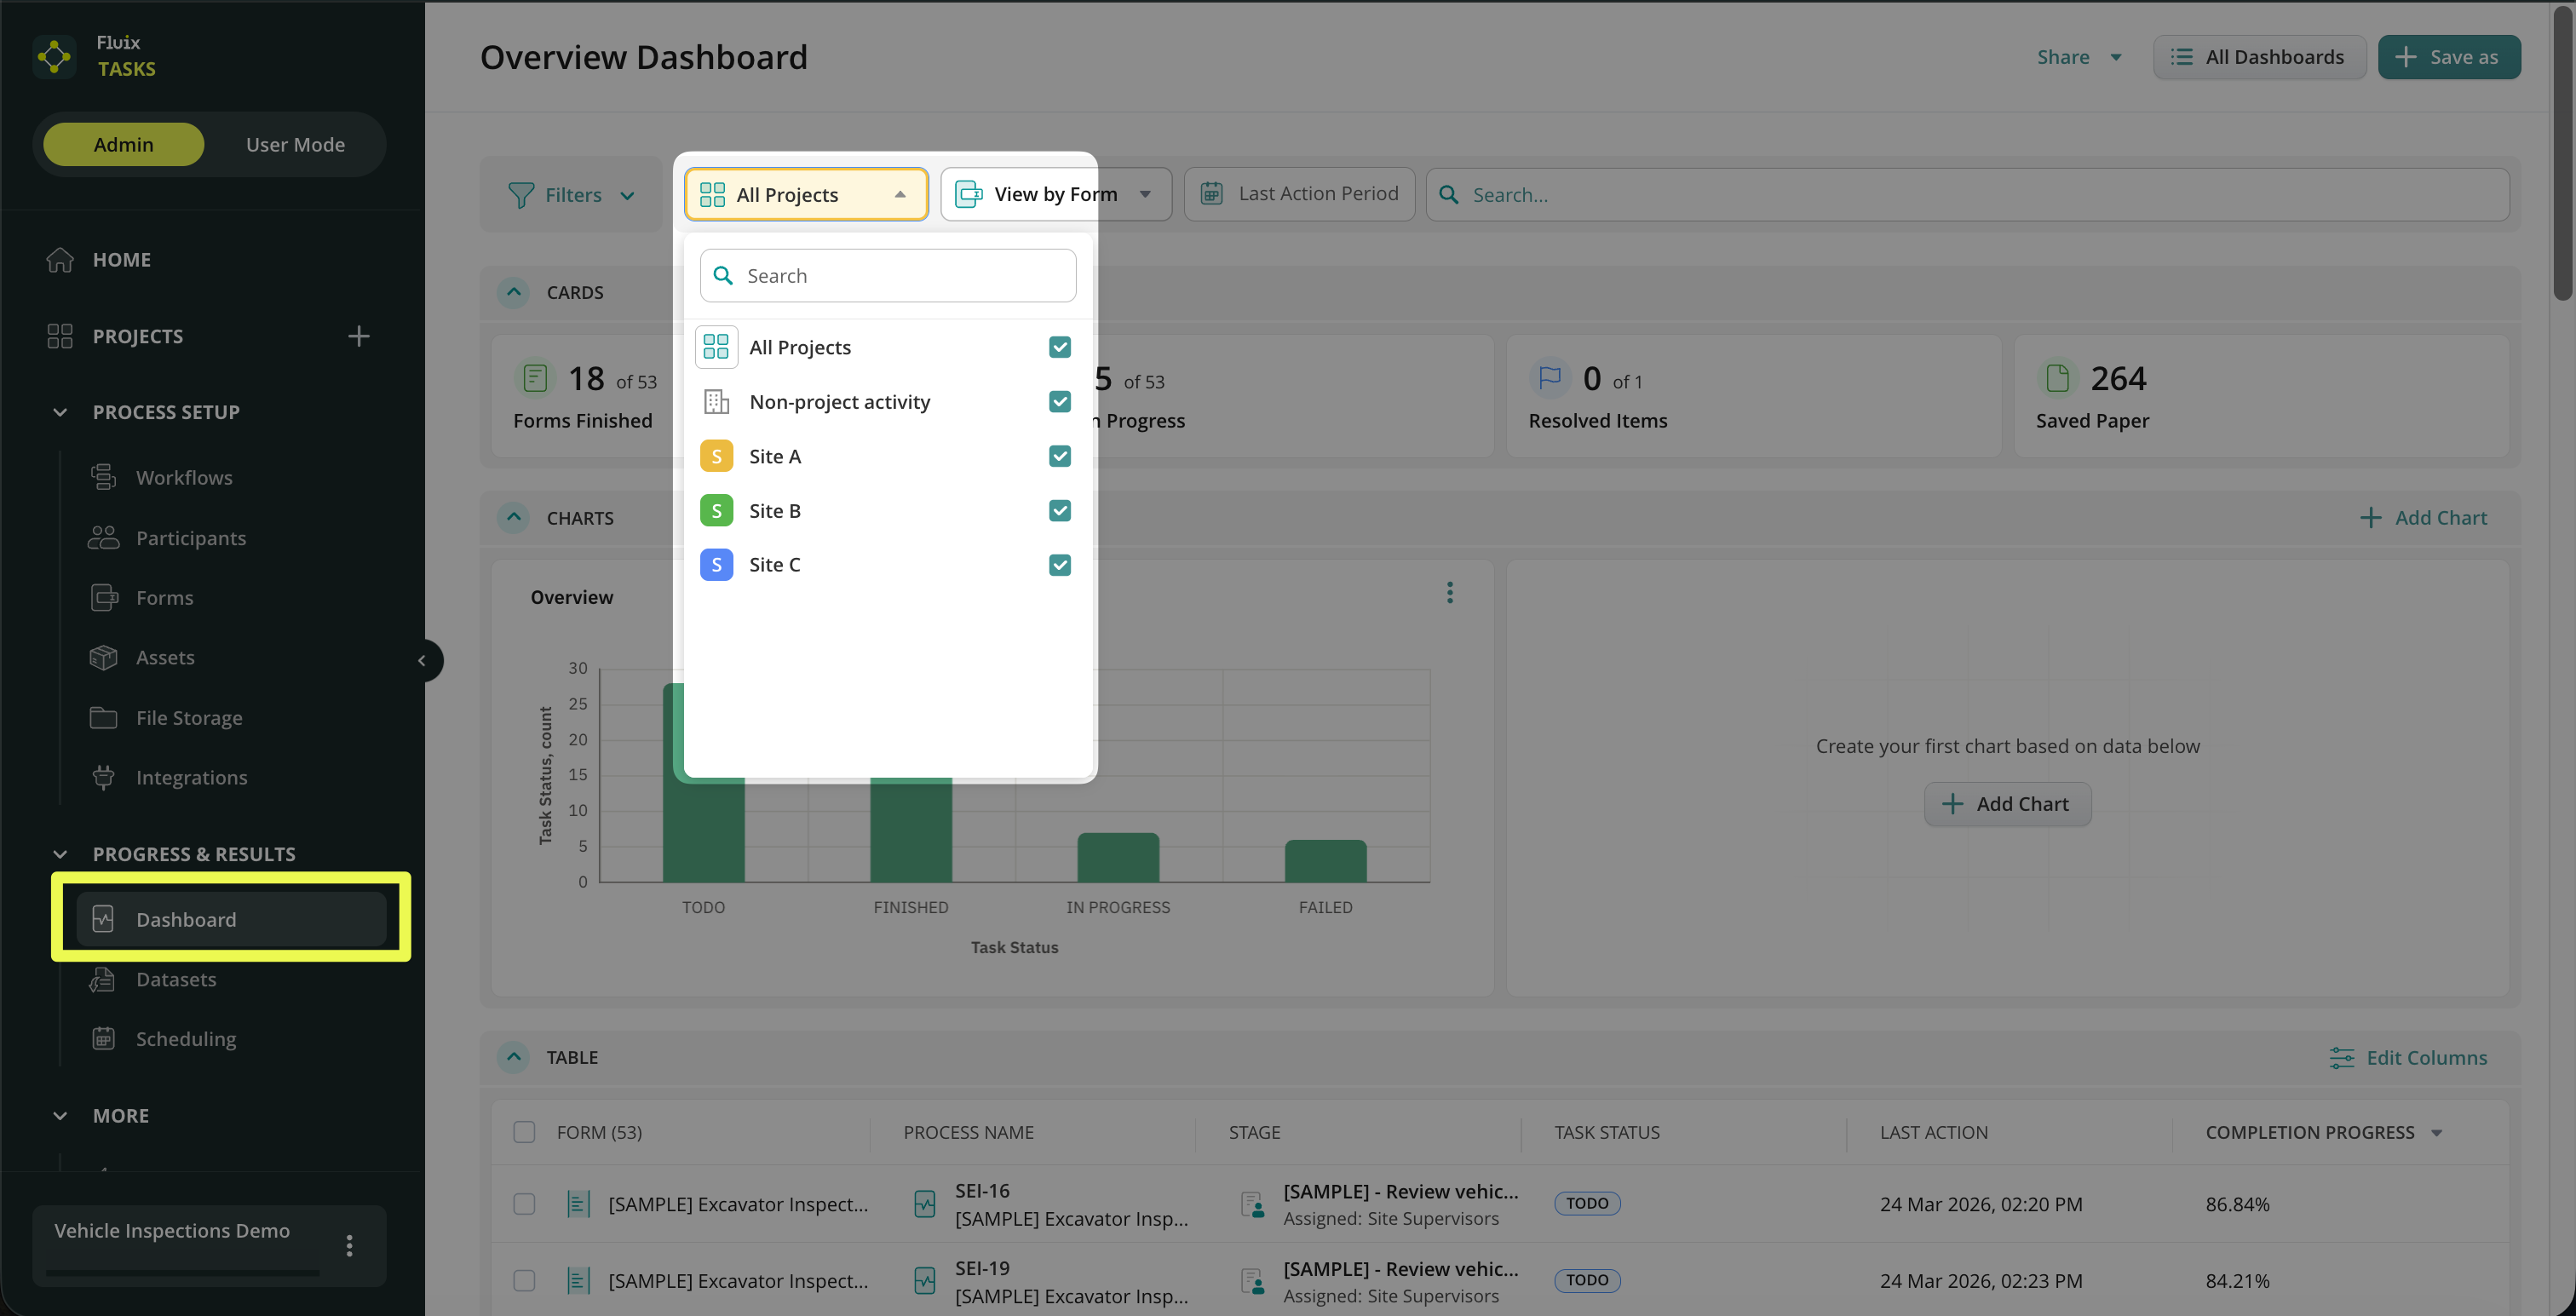
You can also choose which Projects should display data on your main Dashboard.
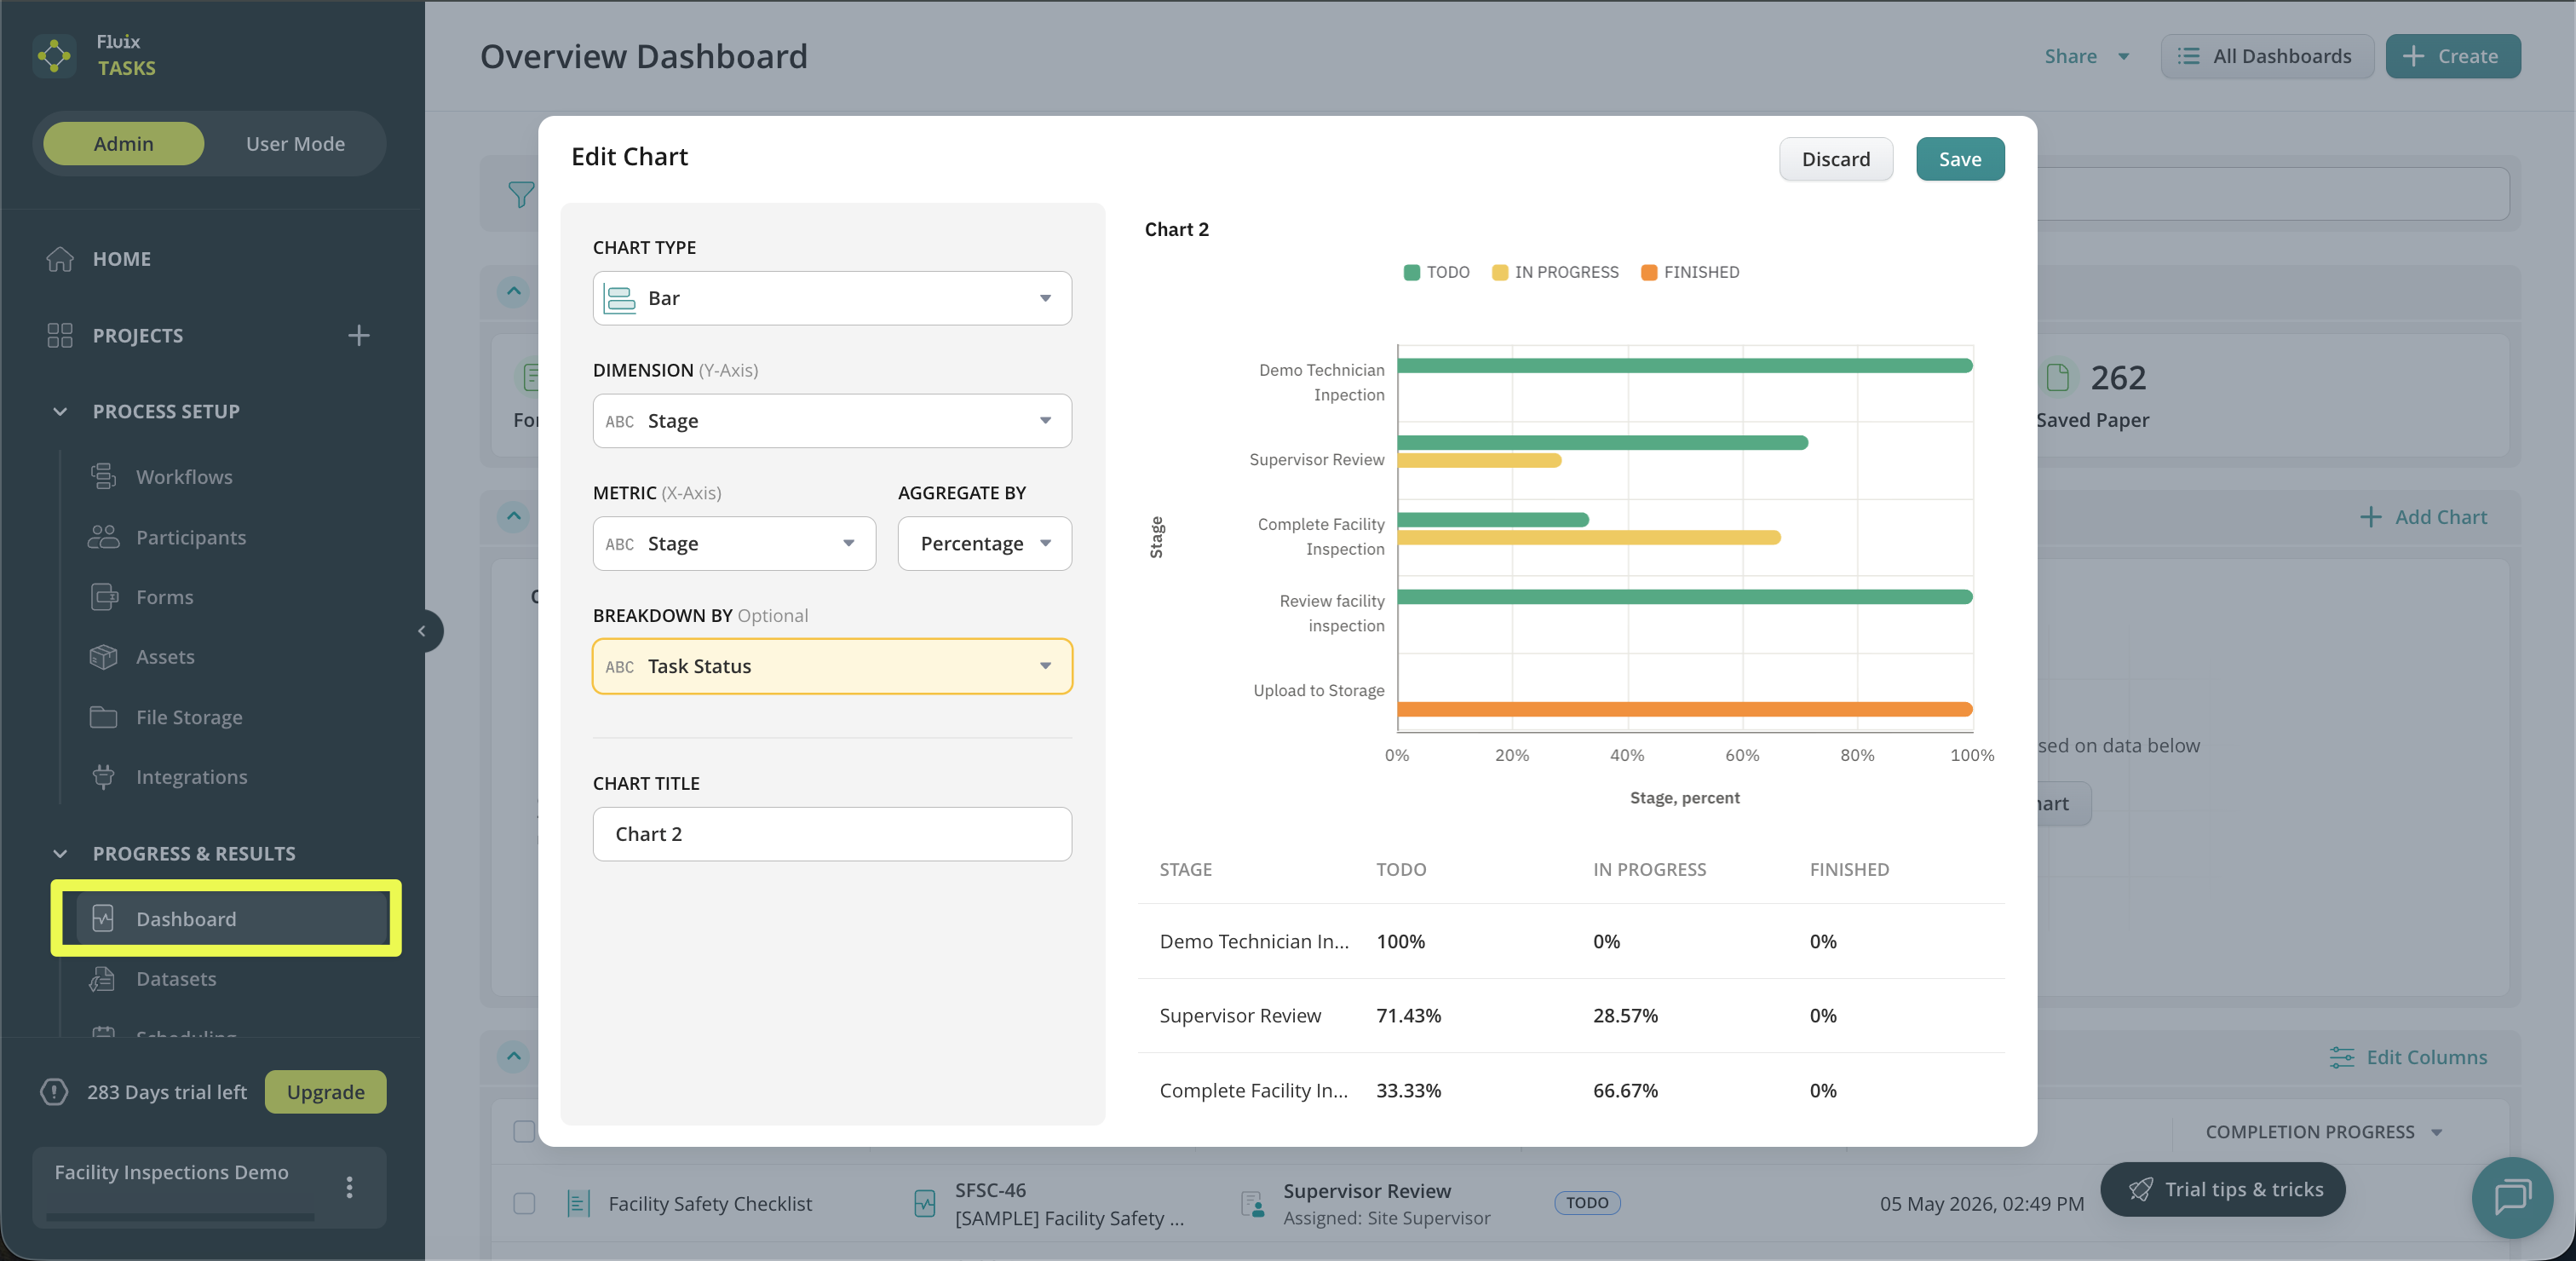
With Charts on Dashboard, you can visualize team performance and make data-driven decisions more efficiently, all without manually analyzing spreadsheets or reports. You can learn more about Charts’ capabilities in Dashboard in this tutorial.
If you have any additional questions about the functionality, contact us at support@fluix.io to learn more.
Was this article helpful?
Thanks for your feedback!
Oops, something went wrong. Please, try again later.
Thank you!
What details or examples would have made this article more helpful for you? We appreciate your insights!
To check the details of the respective process, in the Process View, select the process on which you would like more insights and click Show Details.
There, you will see the task’s history, track the group’s time to complete it, download the forms submitted within the task, troubleshoot, or take action if needed. The Process Details block on the left side of the screen, by default, shows information from the beginning of the flow and the current status of this process. On the right side, you will see an overview of the workflow setup. If you need to make any changes to the workflow, click Edit Initial workflow in the top right corner to open the workflow builder inedit mode.
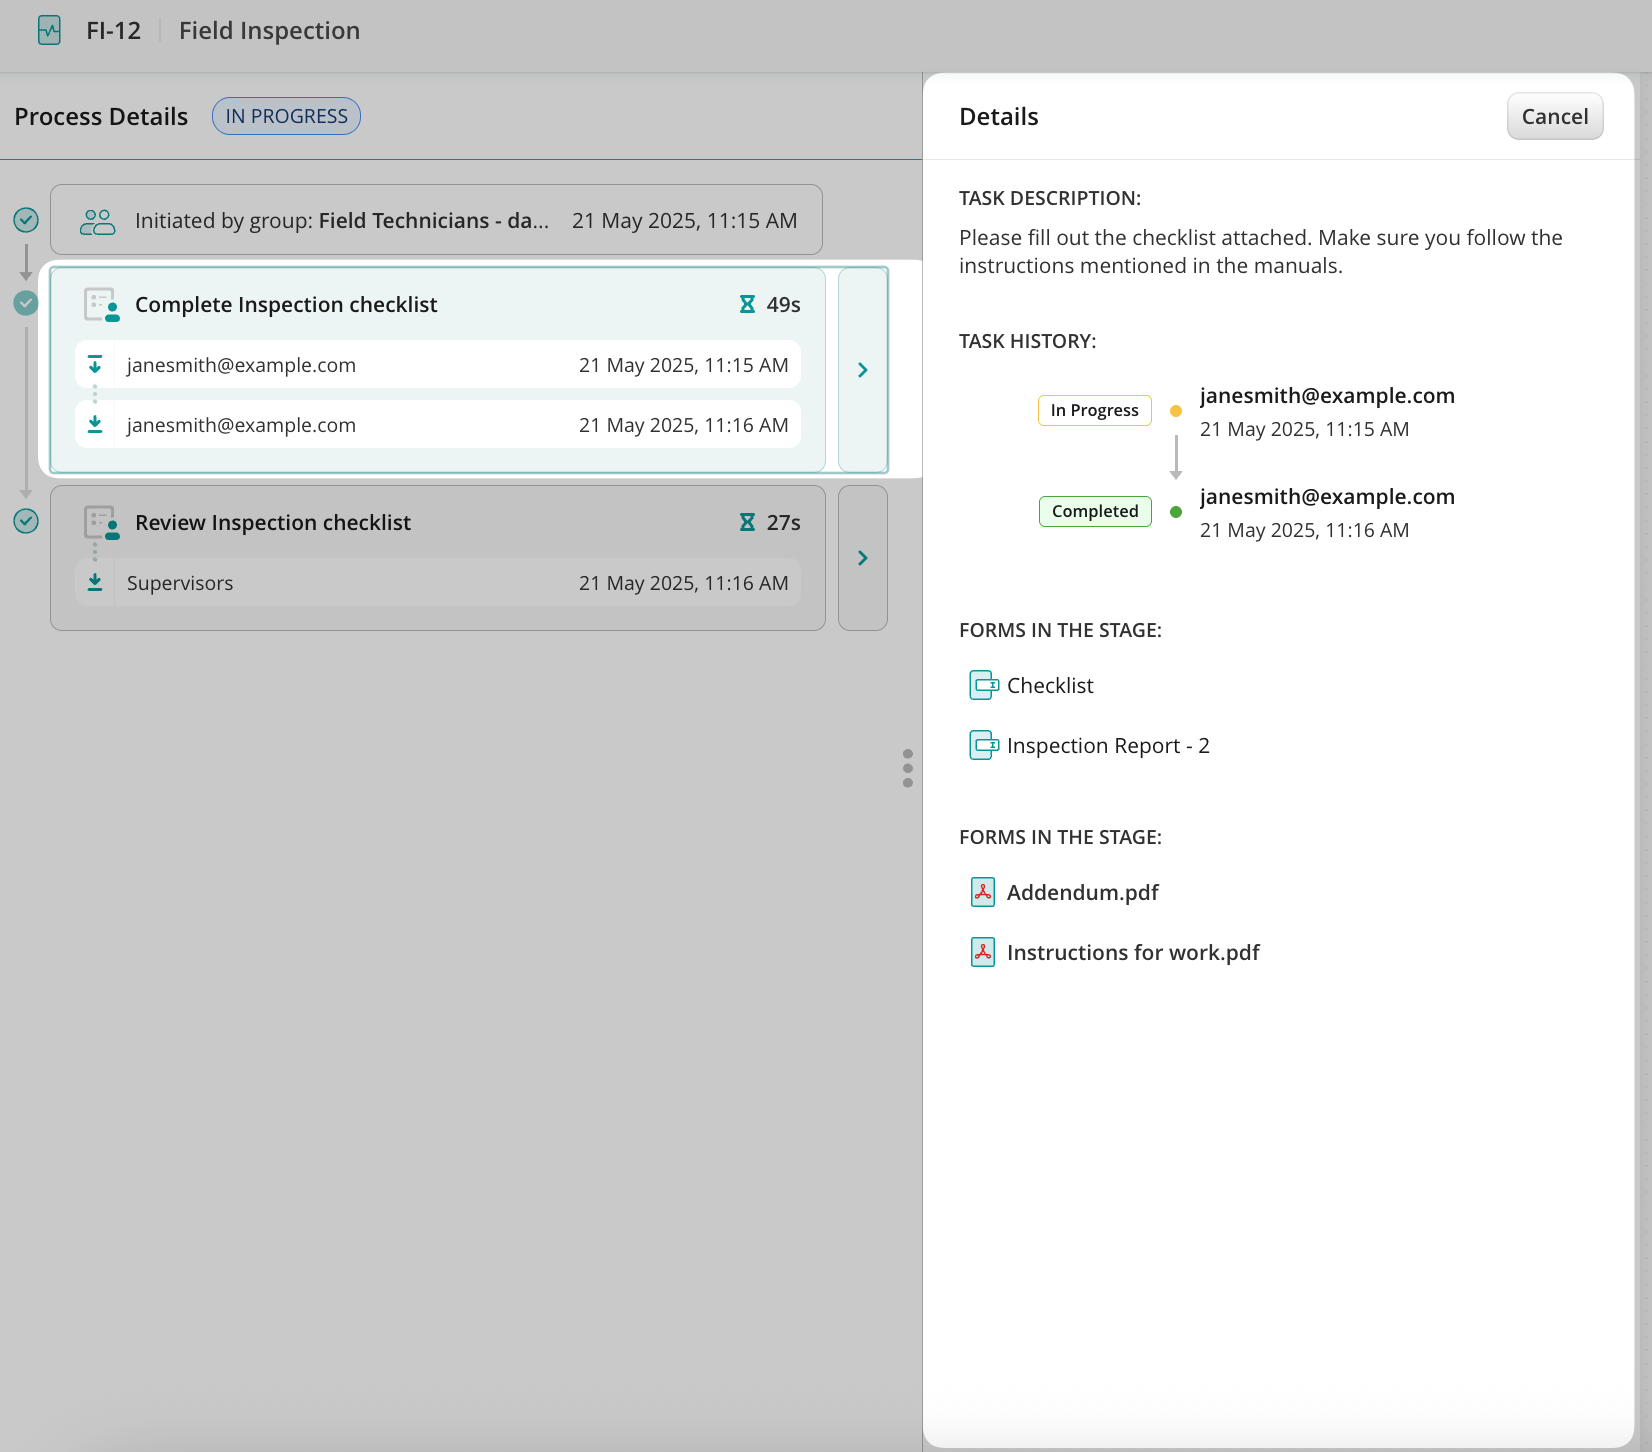
To check the history of the respective task, click on the blue arrow next to the task name.
In the Details section, Fluix will mirror the Task Description from the workflow builder so that you have a complete overview of what the user who initiated the start of this process needed to do in this task. The Task History section shows the email of the task’s performer. Forms in the Stage section store the version of the form submitted by the user or guest. You may view or download the form the user was working on.
Let’s check what the ProcessDetails look like in the example of the two flows:
– successfully submitted;
– failed process.
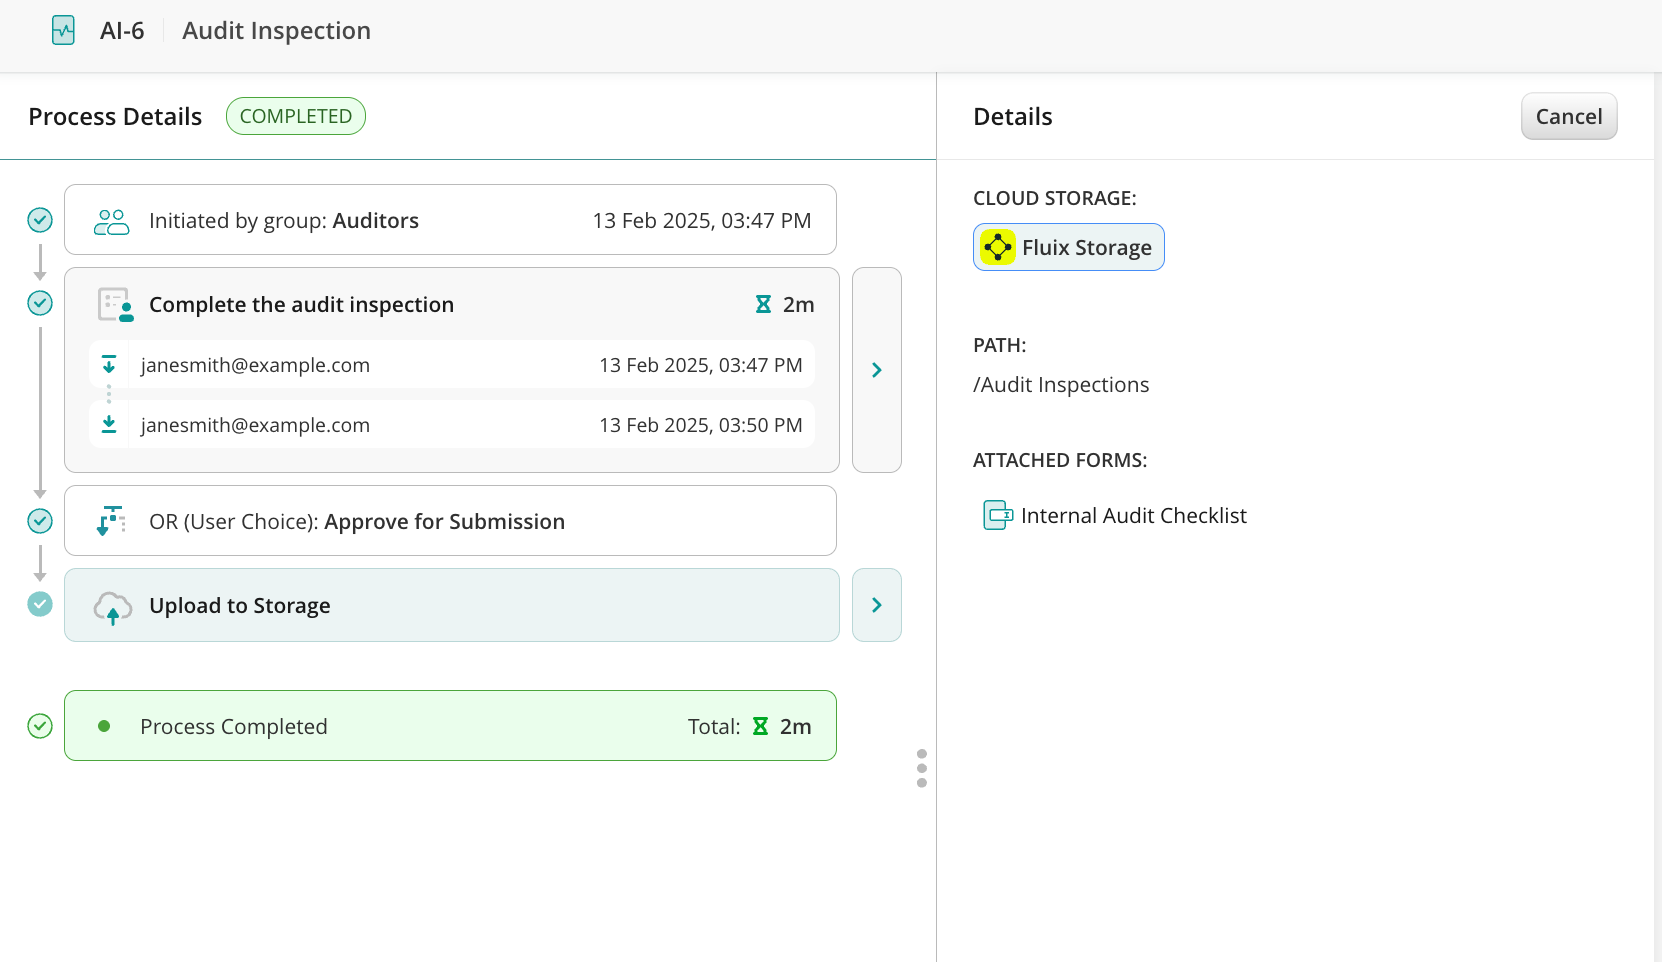
Success Flow: The user finished working on the respective task, hence it was successfully submitted to the path preconfigured in the submit action Upload to storage. Cloud storage will show the storage where the completed form will be stored: Fluix Storage or Third-party storage. The path section will show the directory where the submitted form will be stored. In the Attached forms section, you may download the form by clicking on the Download icon.
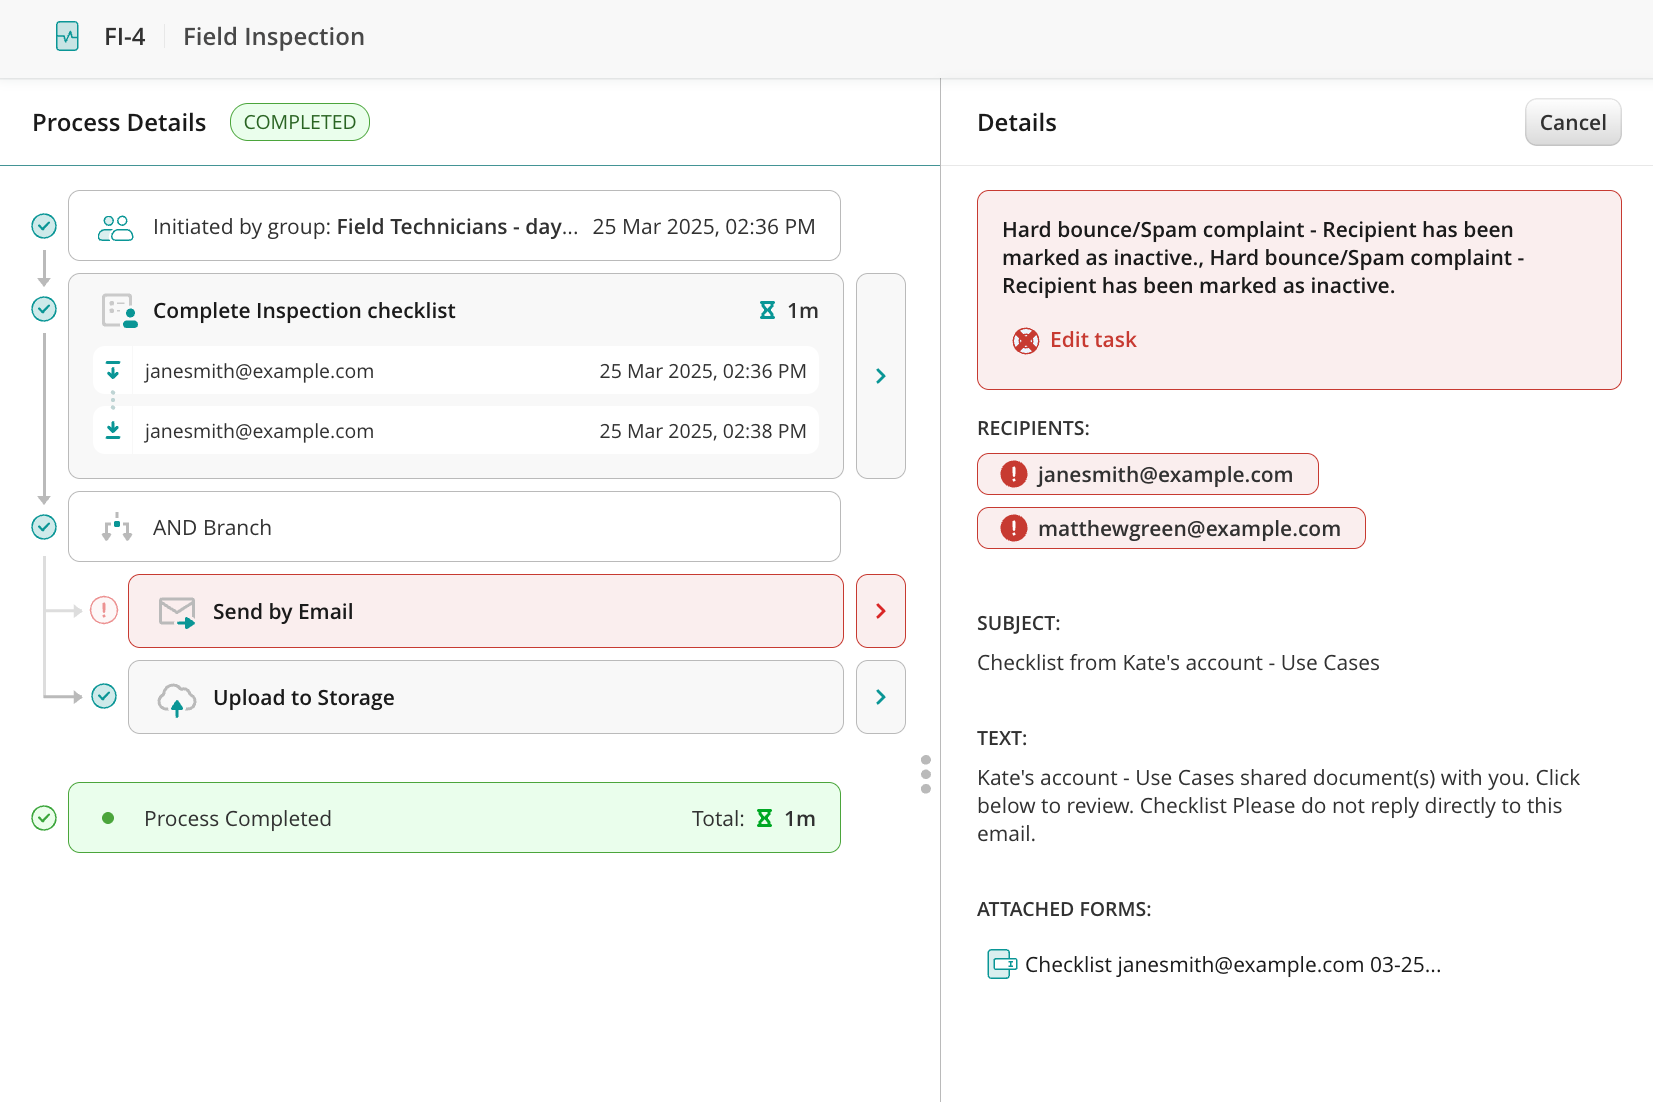
Failed Flow: The user submitted the task to the preconfigured submit action Send by email; however, the process to which the task relates failed to be submitted due to various reasons (e.g., typo in the email address, non-existent email address, etc.). The submit action where the issue occurred will be highlighted in red. Click on the arrow next to the submit action to check the details.
You can check the email addresses to which the documents should have been submitted. For example, you can check if the user who submitted the task mistyped the respective email address.
If you have difficulty understanding why the process failed, contact us at support@fluix.io to learn more.
Was this article helpful?
Thanks for your feedback!
Oops, something went wrong. Please, try again later.
Thank you!
What details or examples would have made this article more helpful for you? We appreciate your insights!
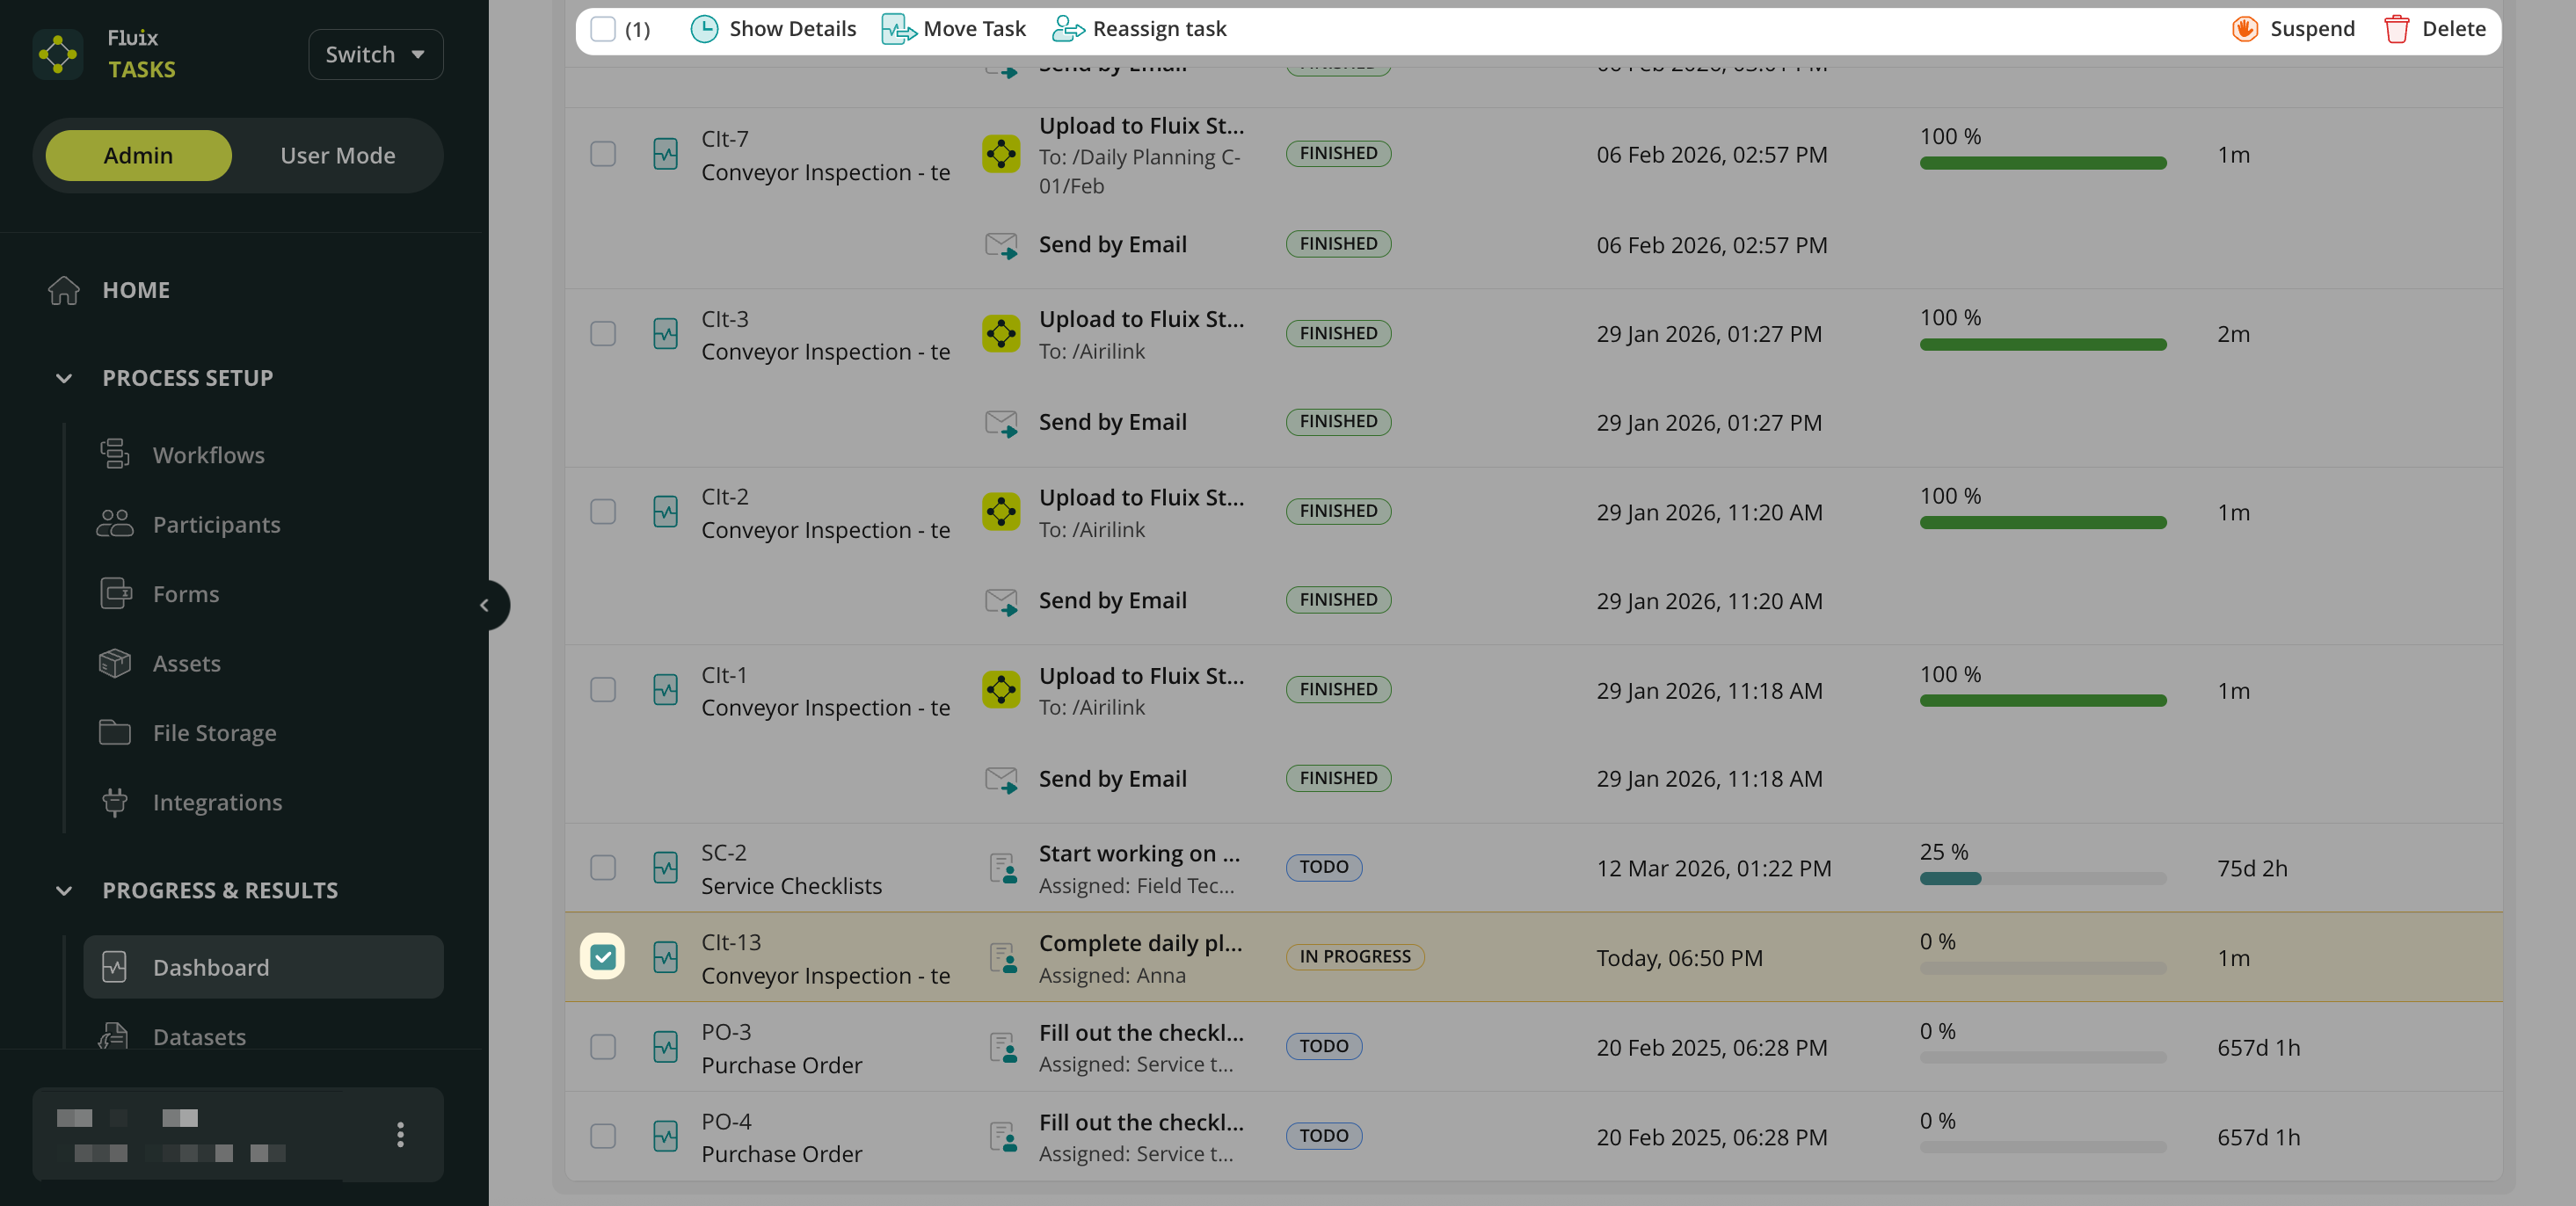
Manage tasks efficiently by moving, pausing, or reassigning them in bulk from the admin portal, streamlining workload distribution. By selecting any process, you can perform the following actions:
Show Details– Open the Process Details page to see a full overview of the process (e.g., who finished the task and how much time it took them to complete it). You can learn more about it by following the link to the article on Process Status Details.
Move Task – This action applies to tasks in the Assigned or In Progress status. You may move tasks one by one or in bulk to the next stage of the process, e.g., from one Group to another. This feature will be helpful in case processes are stuck on certain steps that may not be relevant to complete at this point. Please note: if there are empty required fields in the task you move in bulk, you will see the respective notification about it, but you will be able to move it further.
Reassign task – This action applies to tasks in the Assigned or In Progress status. You may reassign tasks back to the group that performs them or to an individual from this group. This is usually done if the task assigned to a particular user gets stuck because the user is out of the office, sick, or cannot proceed with the task submission for other reasons.
Reassigning a User task:
You may reassign the task to the Group or an individual user from the Group. In this case, the task will be withdrawn from the current assignee and transferred to another one (or to the Group), with changes made by the current one being saved online. The new assignee will receive the task in the Assigned section of the app.
You may resubmit the task via email or SMS. Select one of the options to send a link to the new guest user to access the task.
Suspend – This action applies to tasks in the Assigned or In Progress status. Pause the process for a while and resume it if necessary. This option will be useful in case the current stage of the process is on hold for various reasons. When a User task is suspended, it disappears from the respective user’s Assigned orIn Progress sections in the app.
When the Guest task is suspended, access to the document will be blocked; hence, if the Guest User tries to open it, he will see a notification that it is unavailable.
If you need to resume the process, navigate to Dashboard, select this process, and click Resume in the right corner.
Delete – delete the whole process in case it is irrelevant.
If you need our assistance, feel free to contact us at support@fluix.io.We are always here to help!
Was this article helpful?
Thanks for your feedback!
Oops, something went wrong. Please, try again later.
Thank you!
What details or examples would have made this article more helpful for you? We appreciate your insights!
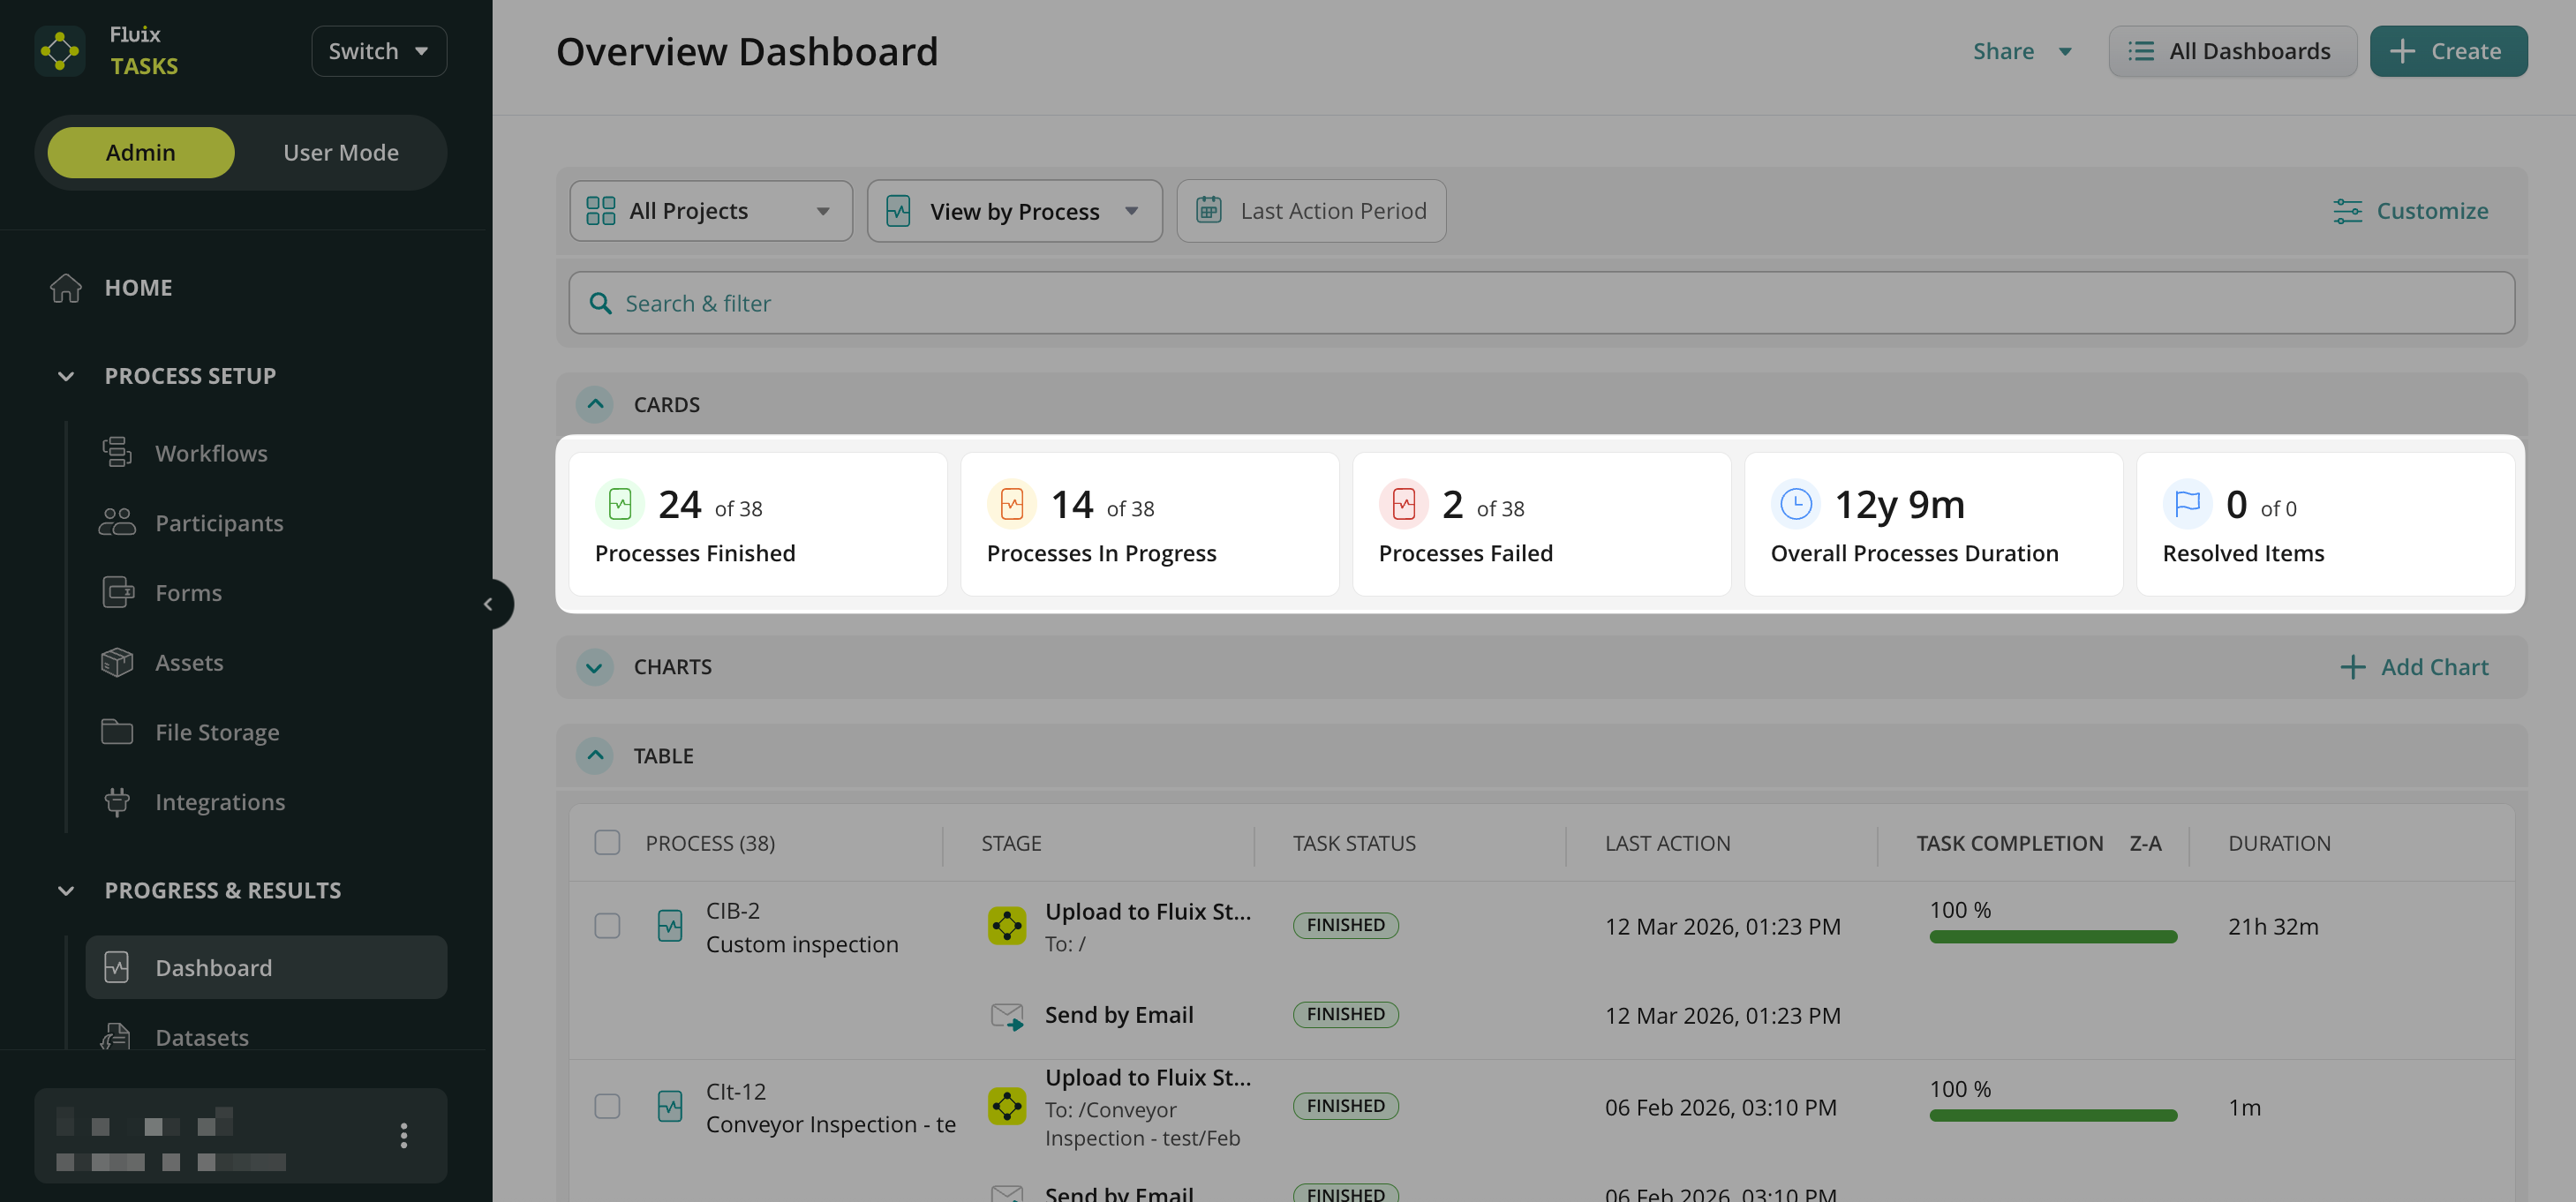
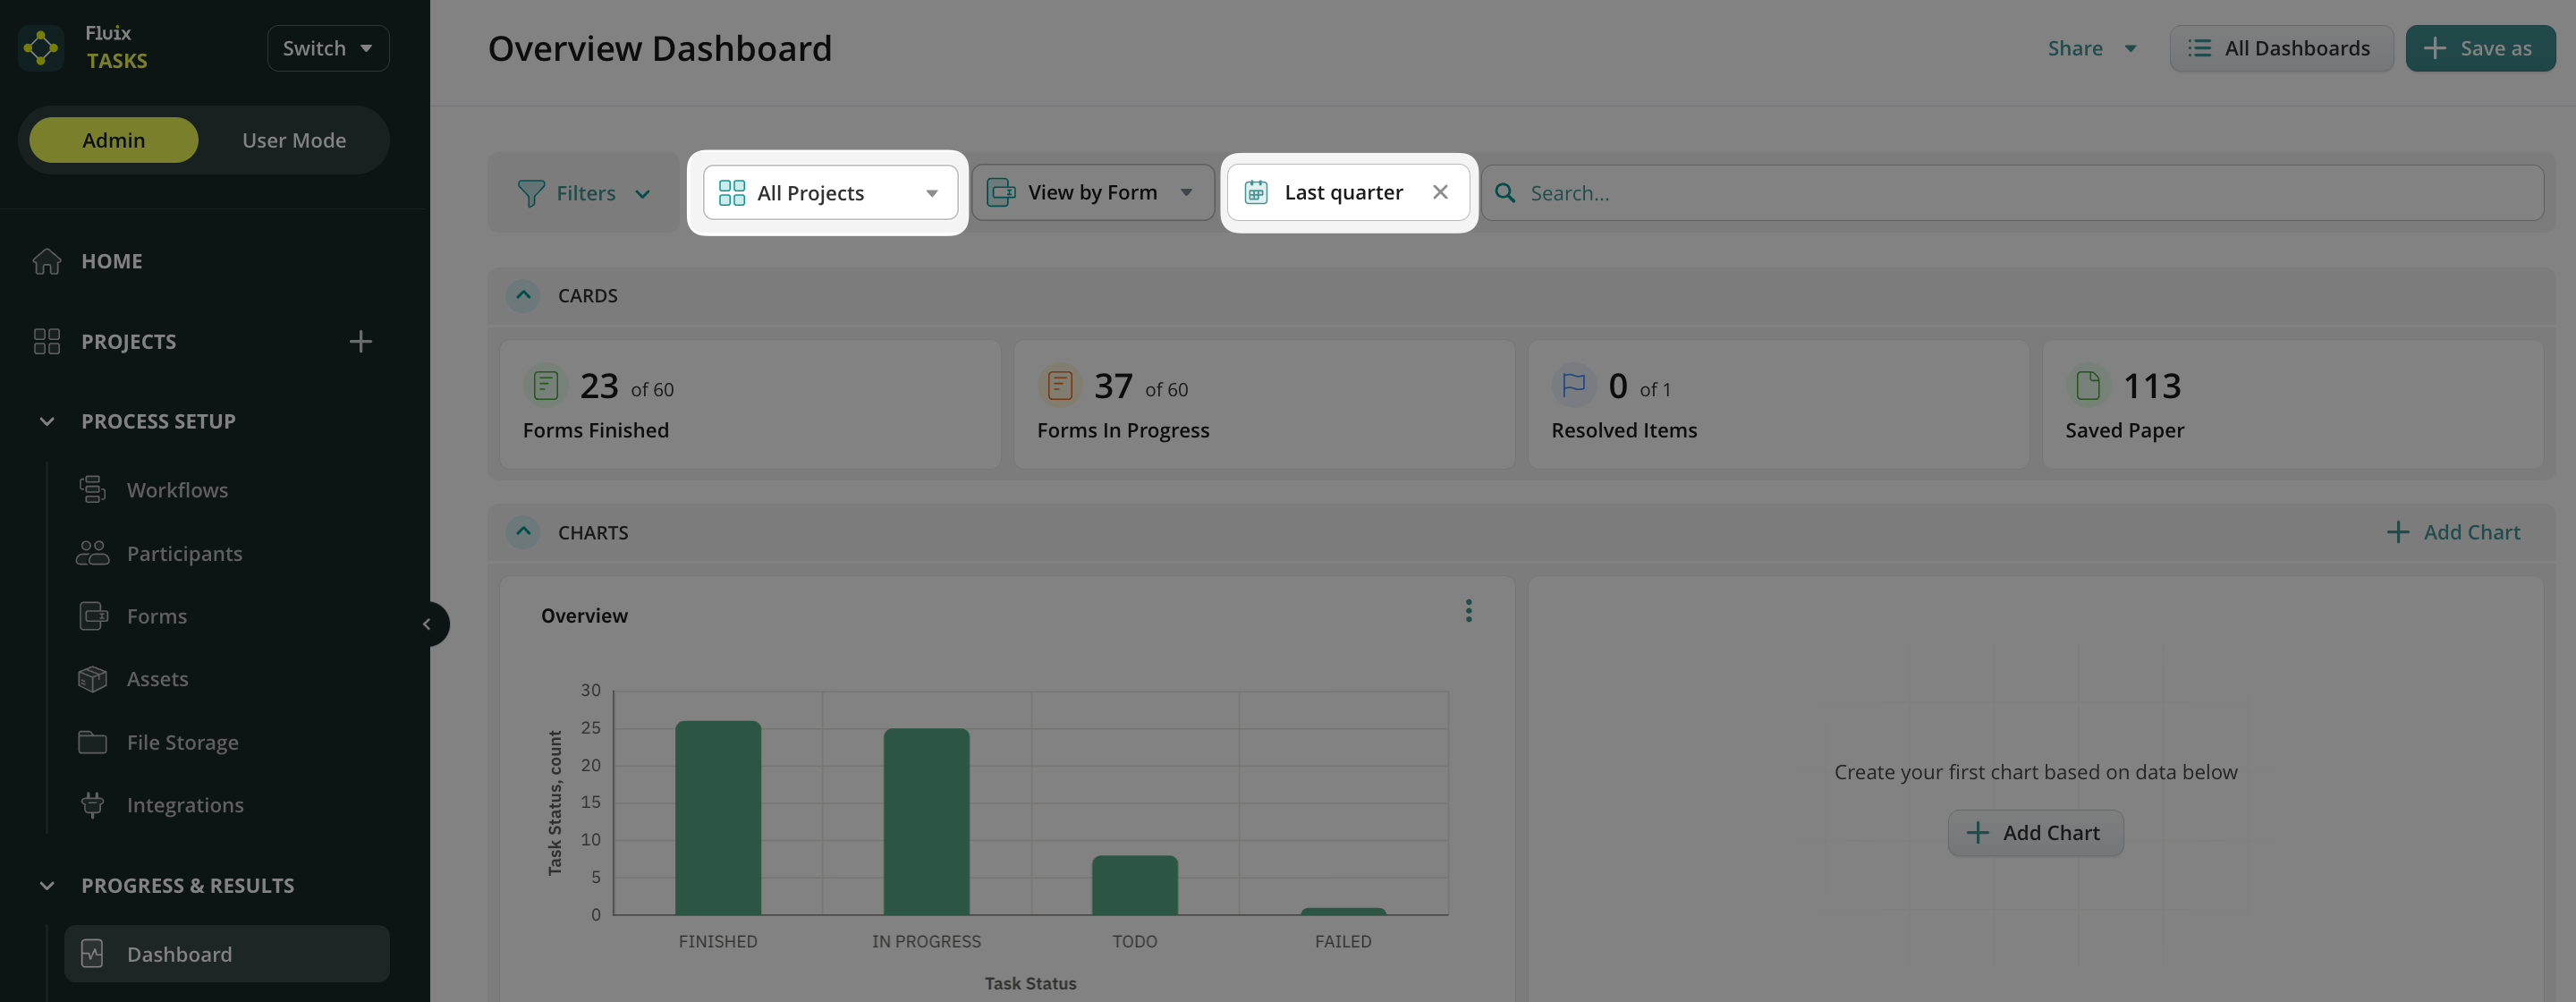
Widgets with the results of your team’s activity in Fluix will significantly help since they allow admins to check data at a glance without the need to dive into the table view of the report. By default, there are five widgets related to the Process view on the screen:
Processes Finished means the total number of finished processes added to the report according to the selected filters.
Processes In Progress means the number of processes that were assigned to groups, users, or guests and are now in the ToDo and InProgress stages.
Processes Failed means that specific service tasks within the process have failed to be uploaded to the configured paths, sent by email, or shared to third-party platforms like HubSpot, Salesforce, etc, and these processes require the admin’s attention.
Overall Process Duration is calculated as the total time users or guests spent working on the processes in the report.
Resolved Items displays the number of items that have already received a resolution, as well as the total number of flagged items included in the report according to the selected filters.
In case you have any additional questions about the functionality, contact us at support@fluix.io to learn more about it.
Was this article helpful?
Thanks for your feedback!
Oops, something went wrong. Please, try again later.
Thank you!
What details or examples would have made this article more helpful for you? We appreciate your insights!
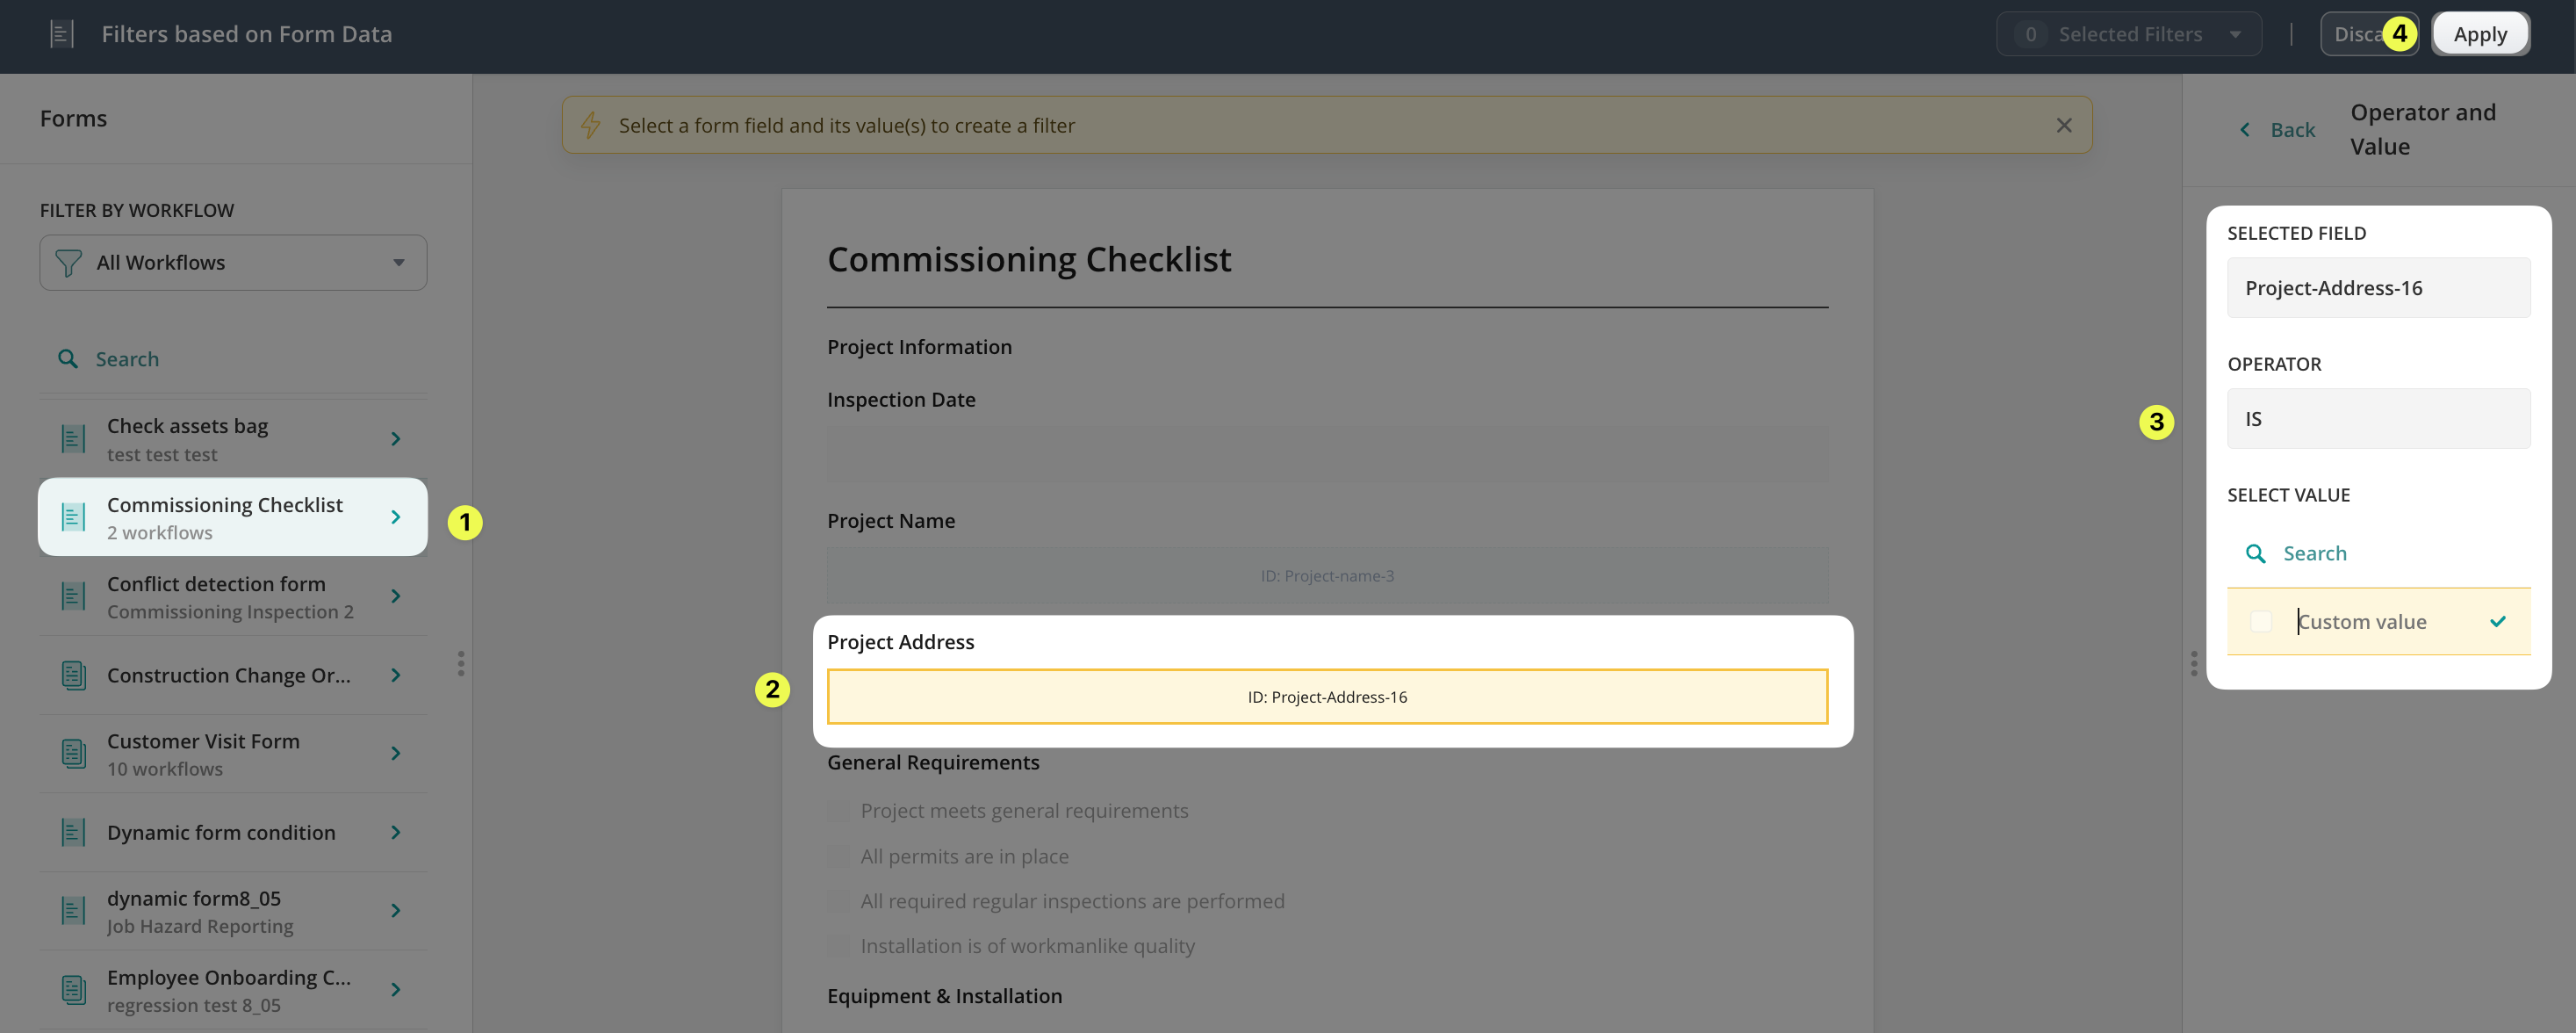
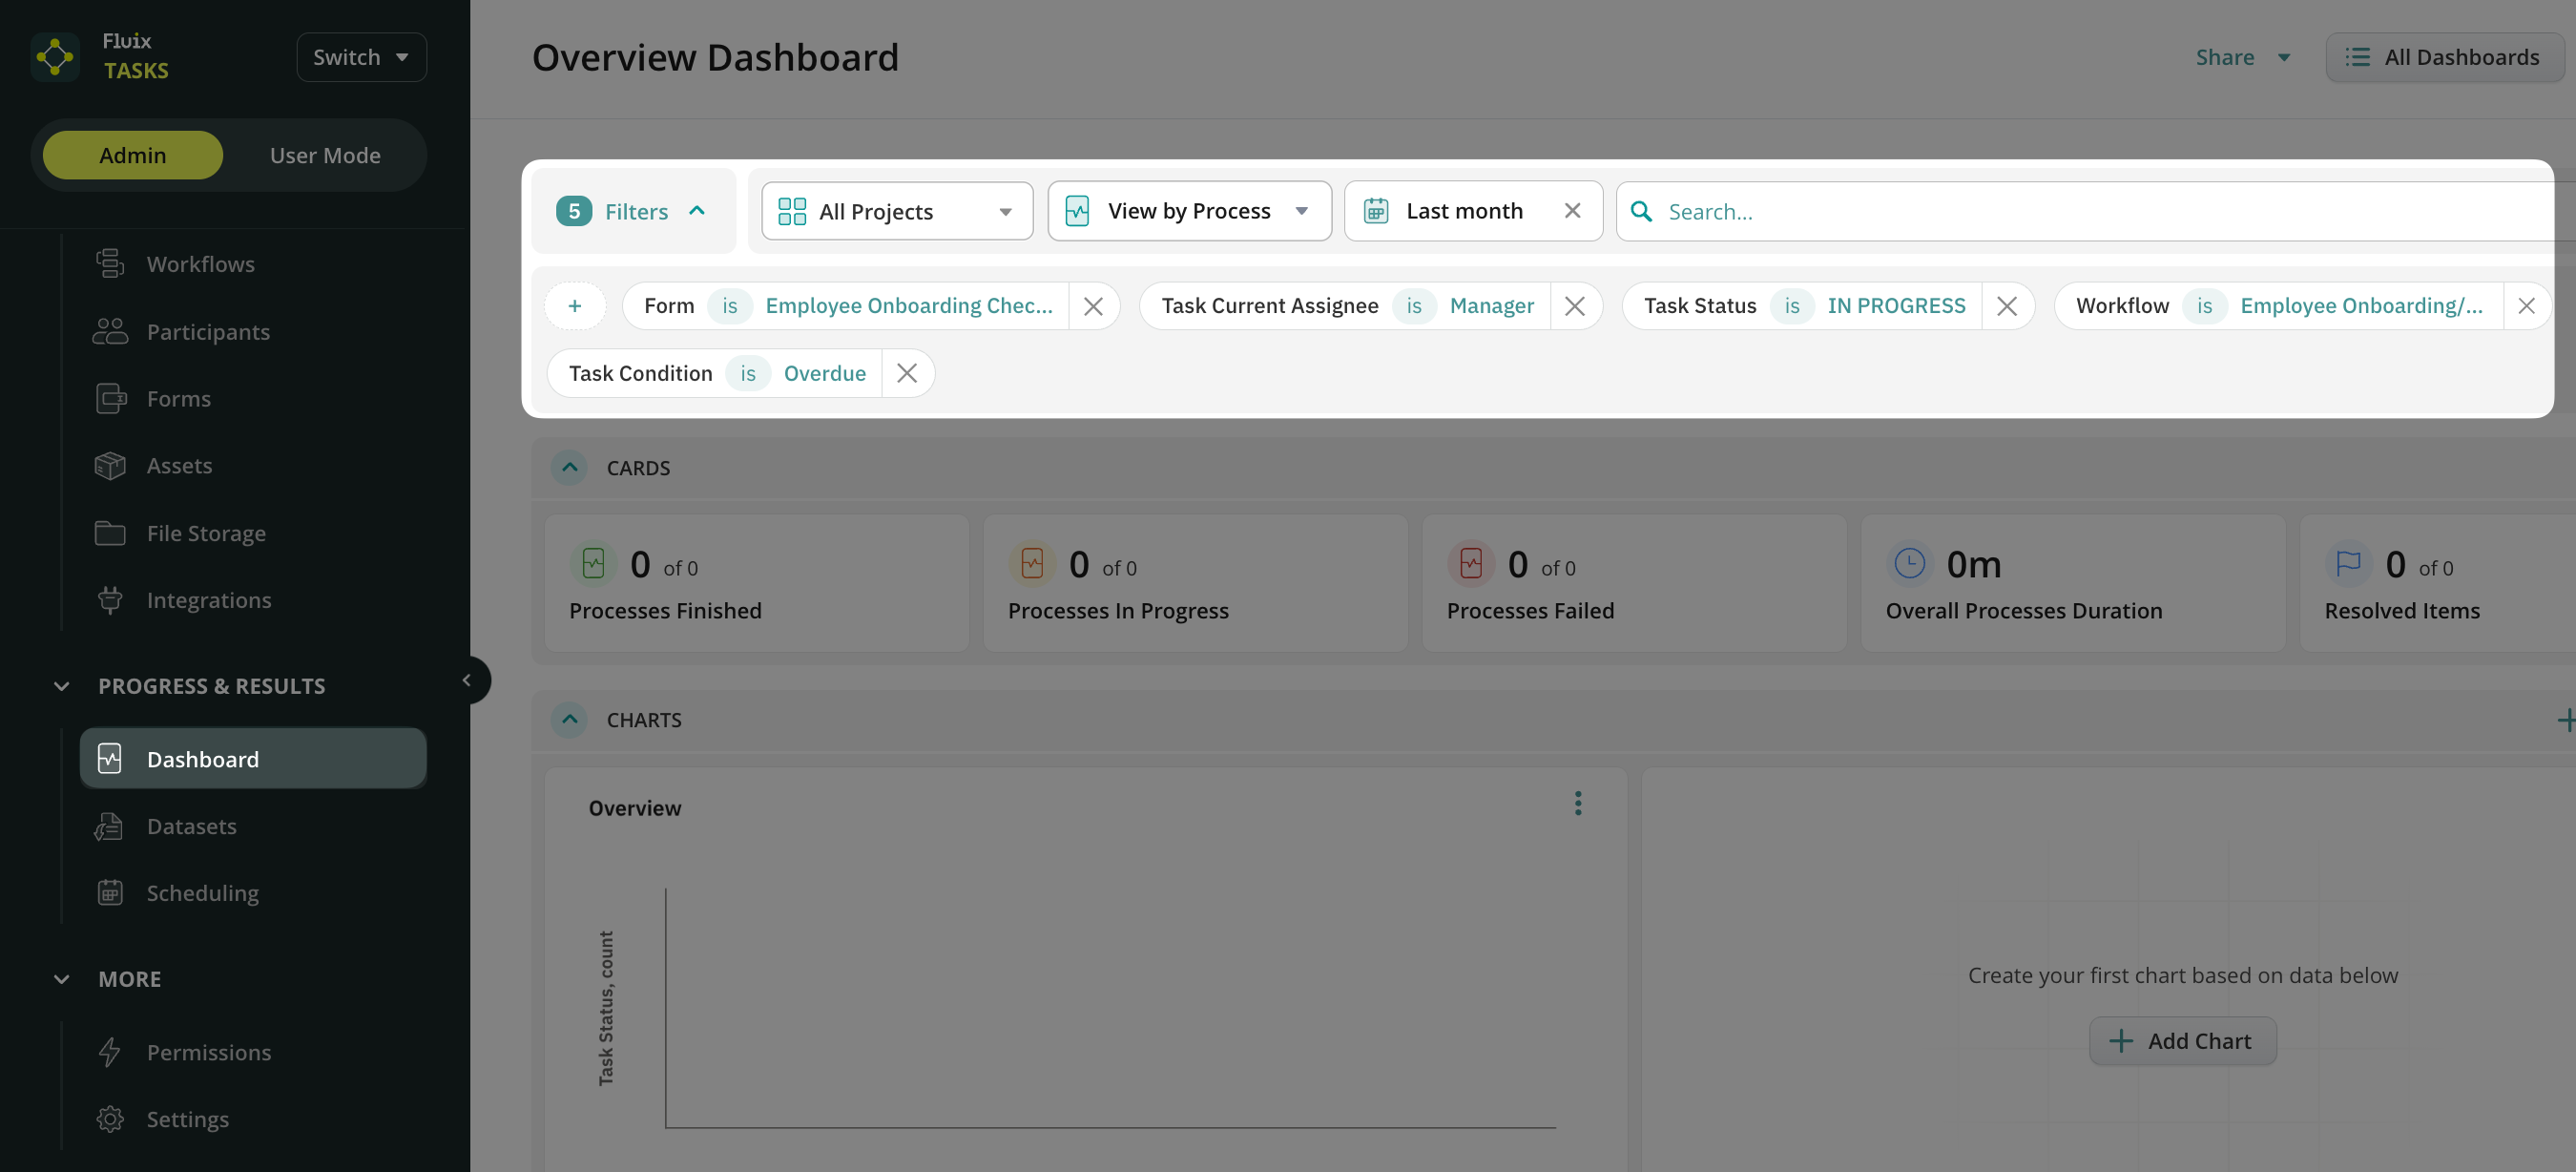
Dashboard Filters provide a powerful way to refine dashboard data, helping quickly focus on the information that matters most. By filtering results based on process attributes or form data, you can uncover meaningful insights and create more detailed reports and charts.
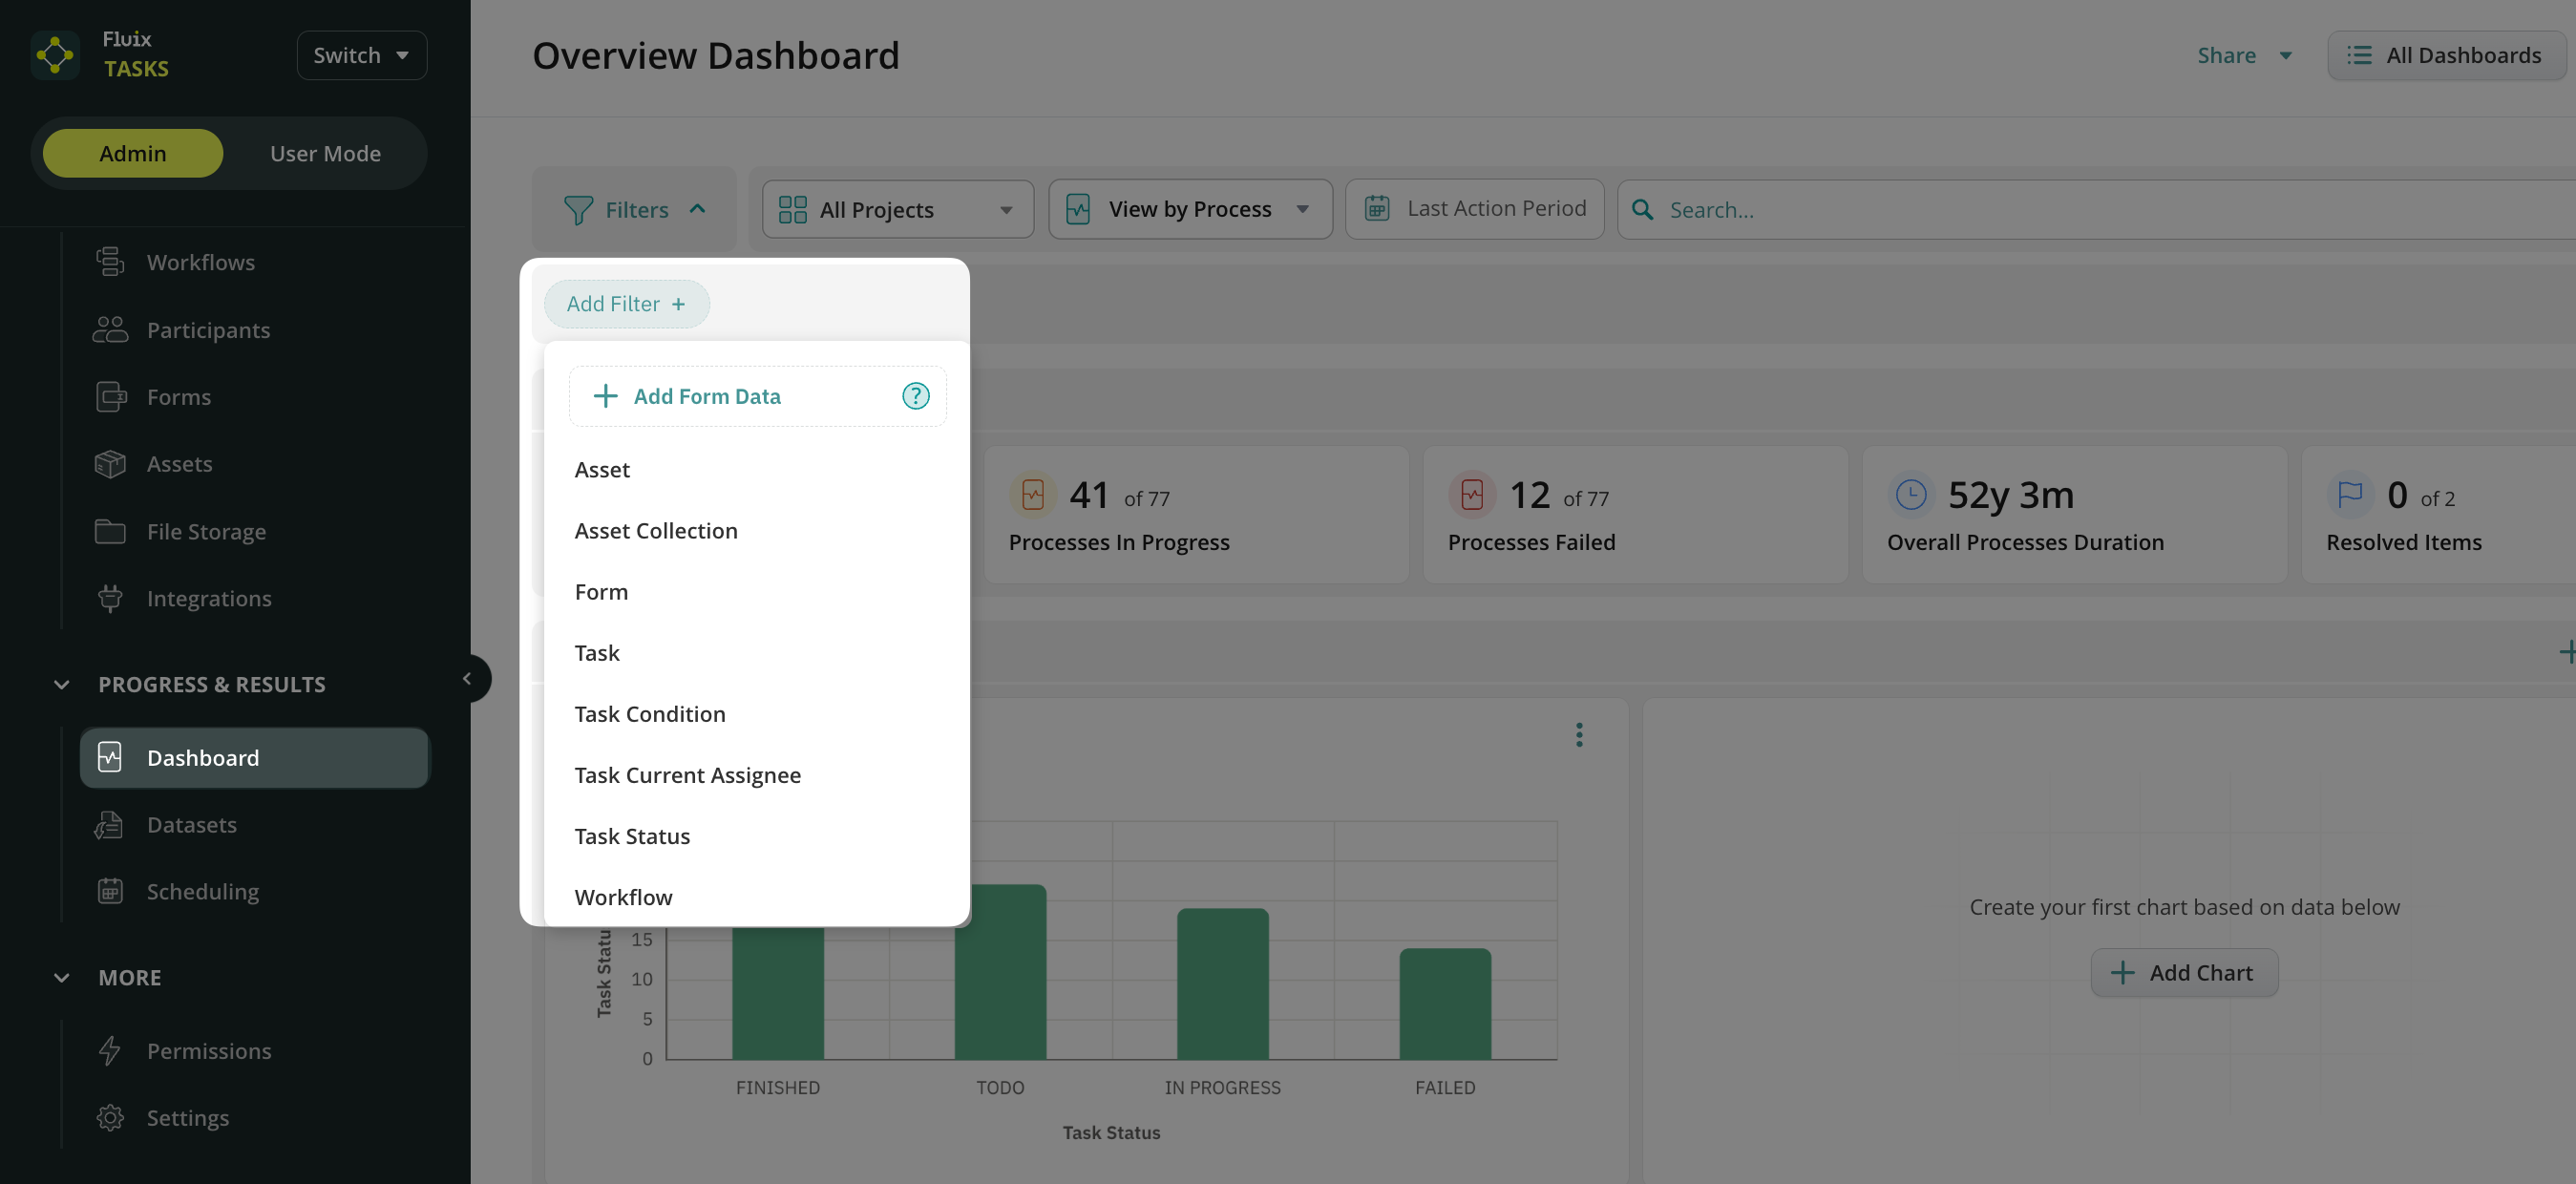
By selecting the Add Filter menu, you can narrow down dashboard results by applying filters based on process information and form data in both View by Process and View by Form.
Add Form Data option provides filtering capabilities by allowing you to filter dashboard data based on values captured in forms. You can select a form field and add a value to quickly locate records that match particular criteria, such as a project name, document number, location, or any other form field value.
Asset limits dashboard results to those associated with a specific asset. Select an asset to view only the processes/forms linked to that asset.
Asset Collection filters by a specific database uploaded to the Fluix Admin Portal.
Flagged Items highlight processes containing flagged records, helping you quickly identify items that require attention or follow-up.
Form allows you to focus on data originating from one or more selected forms. Choose a form from the available list to view only the processes related to that form.
Report Added lets you check which processes or forms (depending on your View By selection) have a generated Issue Summary.
Task filters the active processes based on the task name entered in the field.
Task Condition helps identify tasks that are Overdue or Undelivered, so that you can contact the user, group, or guest and follow up on the task’s progress.
Task Current Assignee shows activities assigned to a selected user or group.
Task Status filters the processes by To Do, In Progress, Finished, Failed, Deleted, and Suspended statuses.
Workflow displays information associated with the selected workflow.
Multiple filters can be applied simultaneously, making it easy to create highly targeted dashboard views. For example, you can combine form, workflow, task status, task assignee, and form field values to display only the information relevant to your analysis.
In addition, dashboard data can be further refined by Project and Period.
Project allows you to focus on information associated with a specific project. Select a project from the available list to display only data related to that project.
Period allows you to analyze information within a selected timeframe. Choose a predefined date range or specify a custom period to focus on recent activity or performance during a particular time window.
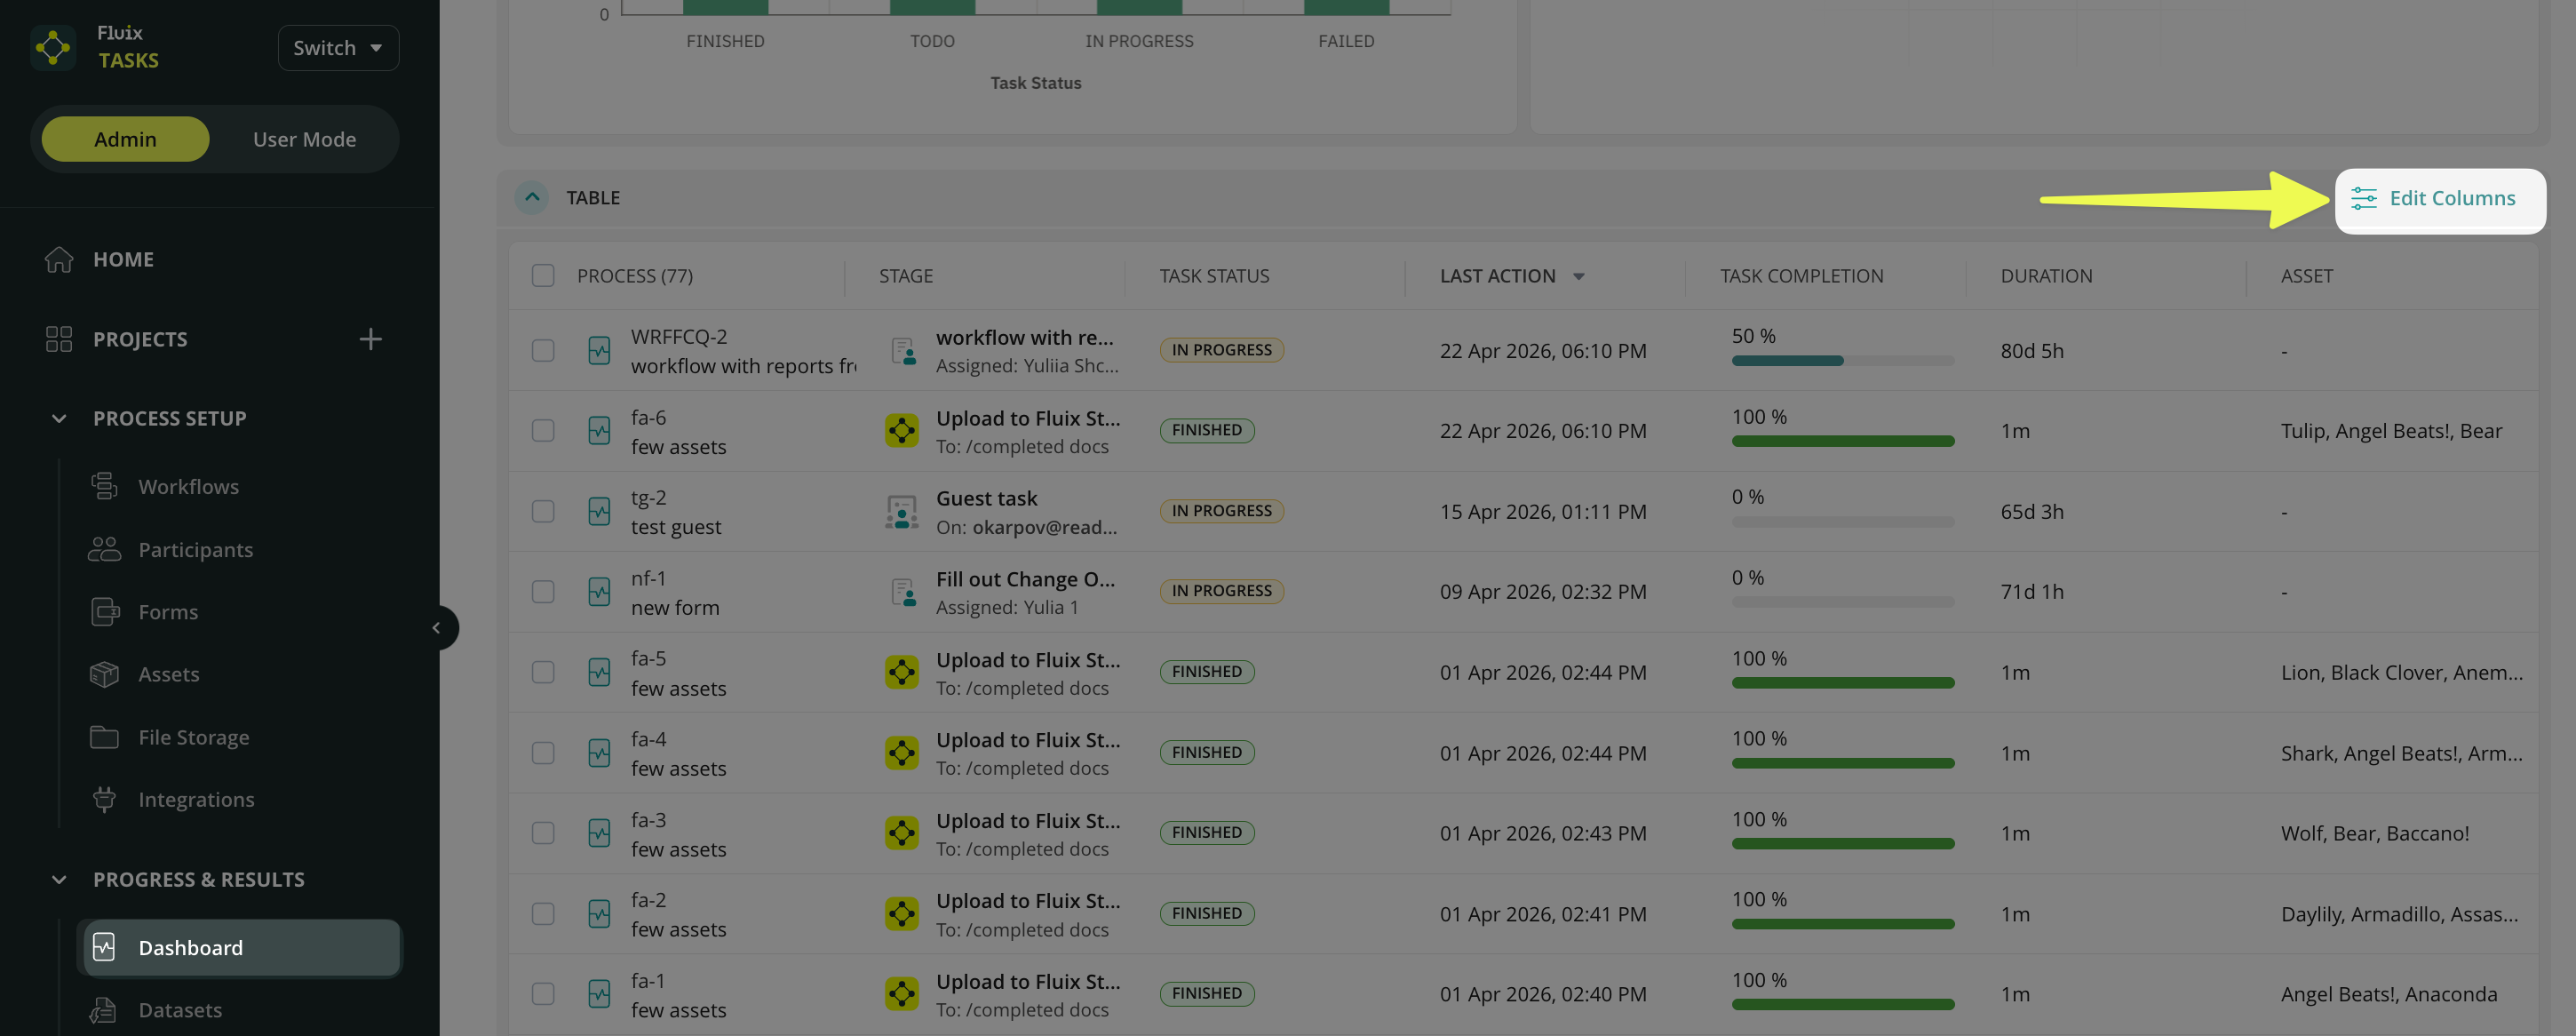
How to customize data in your Dashboard?
The Dashboard can be customized to display the information most relevant to your business needs. You can tailor the dashboard by adding charts to visualize key metrics and trends, as well as by modifying the data table. Learn more about Charts functionality in this article.
To customize the columns in your Dashboard, click the Edit Columns button. Table customization options include adding new columns, removing existing columns, or replacing columns with different data fields. This flexibility allows you to create dashboard views that support your reporting requirements and provide quick access to the most important information.Learn more about customization in the tutorial “Customizing and Sharing the Report.”
If you have any additional questions about the functionality, contact us at support@fluix.io to learn more.
Was this article helpful?
Thanks for your feedback!
Oops, something went wrong. Please, try again later.
Thank you!
What details or examples would have made this article more helpful for you? We appreciate your insights!
By routing images directly to your ‘Dashboard’, you’ll simplify the photo review and reporting process. You can eliminate manual image handling, and the new thumbnail view lets you verify media without opening individual PDFs.
Furthermore, the option to export forms and media as a single consolidated ZIP file or as standalone image sets enables you to share documentation with clients more efficiently.
Let’s take a closer look at both of these options.
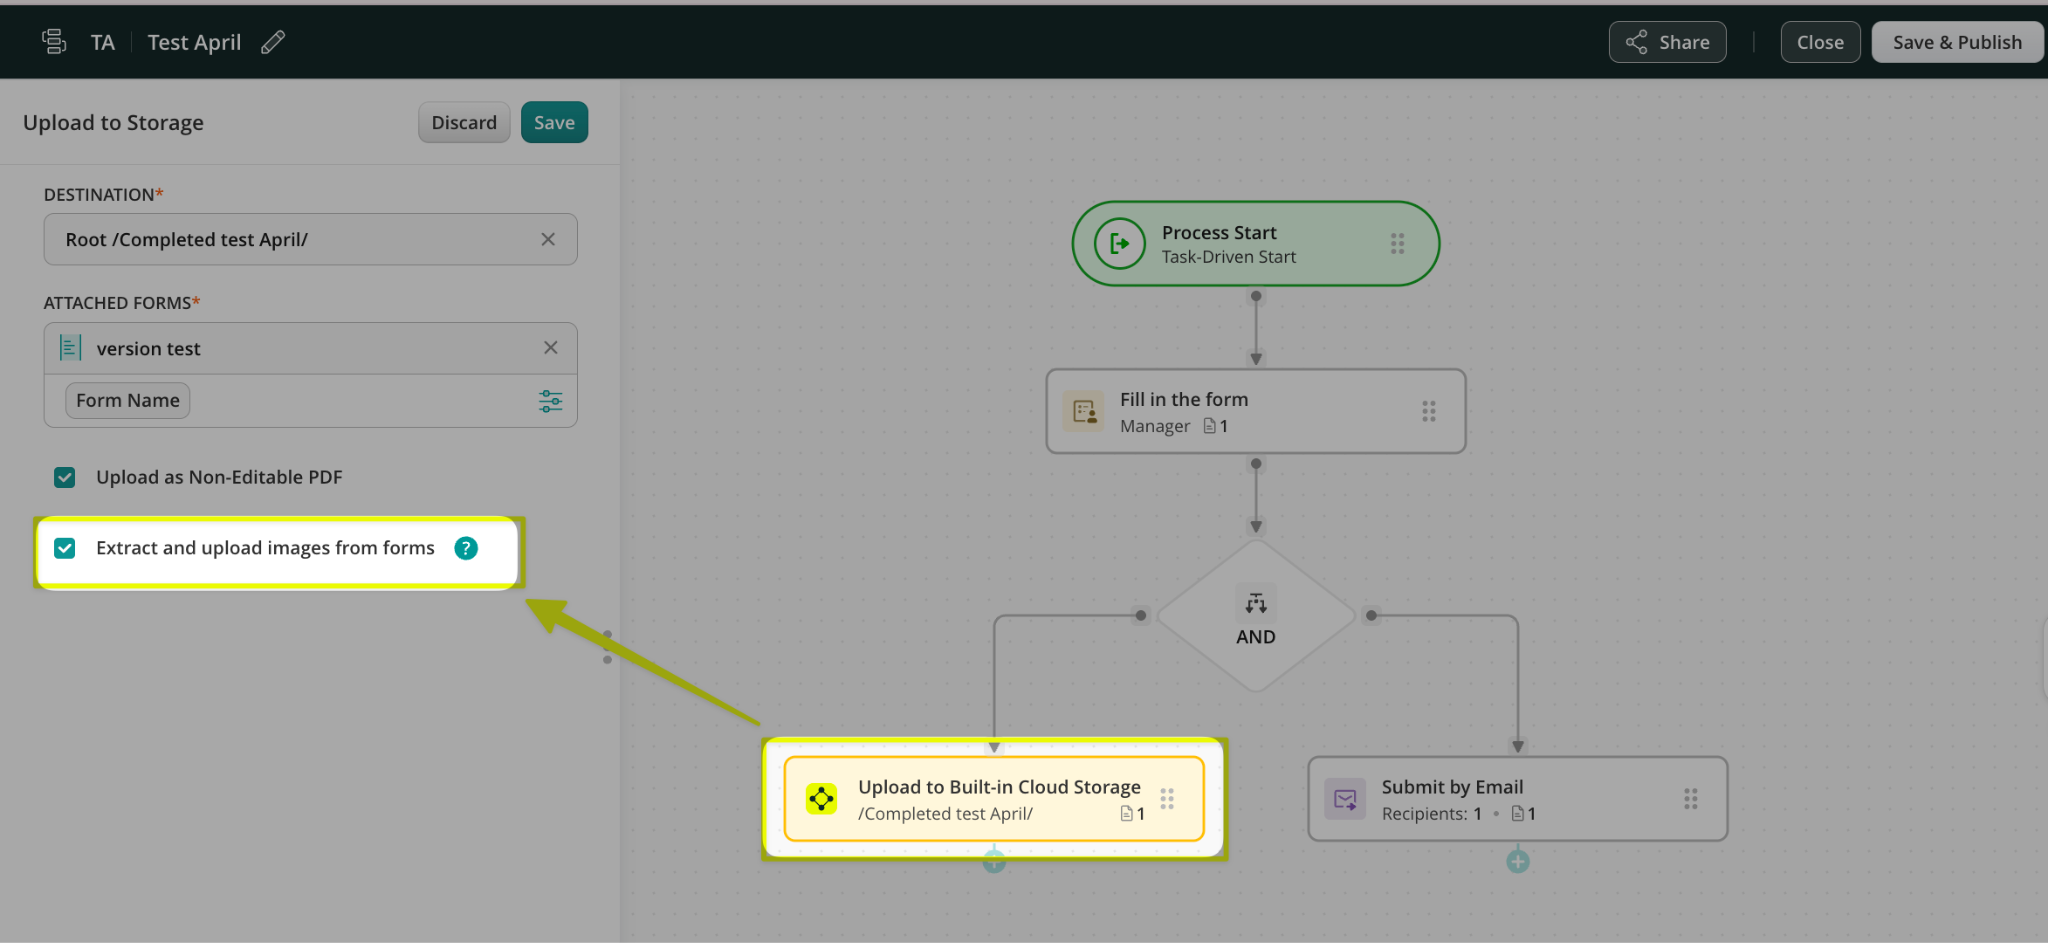
How to extract images separately to Fluix Storage?
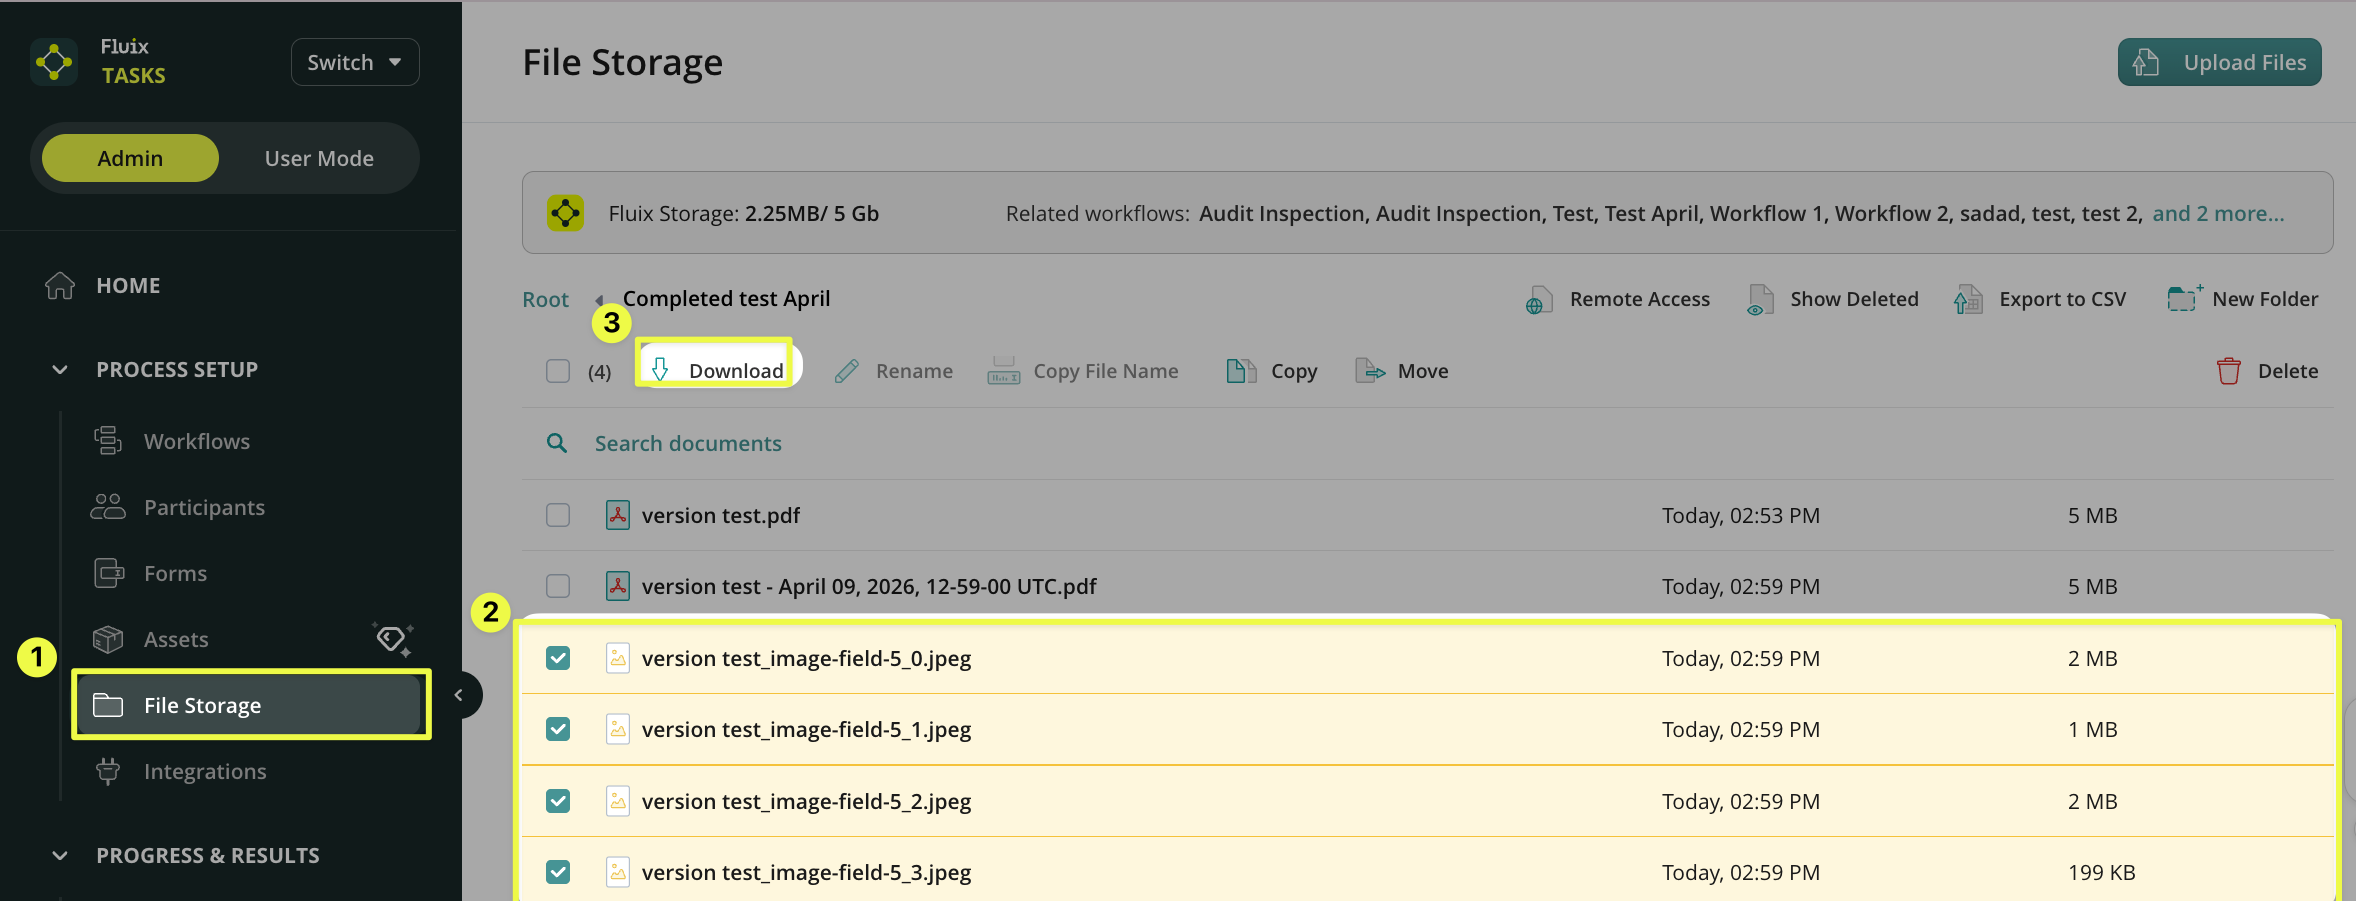
You can configure image extraction to File Storage in the workflow builder using the Upload to Storage action.
What does this mean for your forms and processes?
When completed tasks are submitted, the filled forms are archived to the preconfigured destination in your selected cloud storage. Any images added to the forms are also uploaded separately to the same destination path.
Below is an example of how this may look in case you store the completed PDFs in Fluix File Storage:a completed form submitted by your field team, along with the separate images they added to the form.
Note: Images added to a form are still saved within the form itself. This option provides an additional way to store images separately for quicker access when needed.
How to preview images from tasks in Dashboard?
The option to ‘Extract images from forms’ from the Dashboard can be enabled by following the instructions below:
Navigate to the Admin Panel -> ‘Dashboard’ section -> ‘All Dashboard’ button on your screen:
Click on the “Create board” button
Switch on the toggle ‘Show image Thumbnails’ at the bottom left corner of your screen.
Click on the‘Form Field Data’ -> choose the form for which you would like to see thumbnails. Click the ‘Continue’ button.
Select the image fields that you would like to preview and click on the ‘Save’
Click on the ‘Save’ button.
Please provide the name to your Dashboard and click on the “Save” button
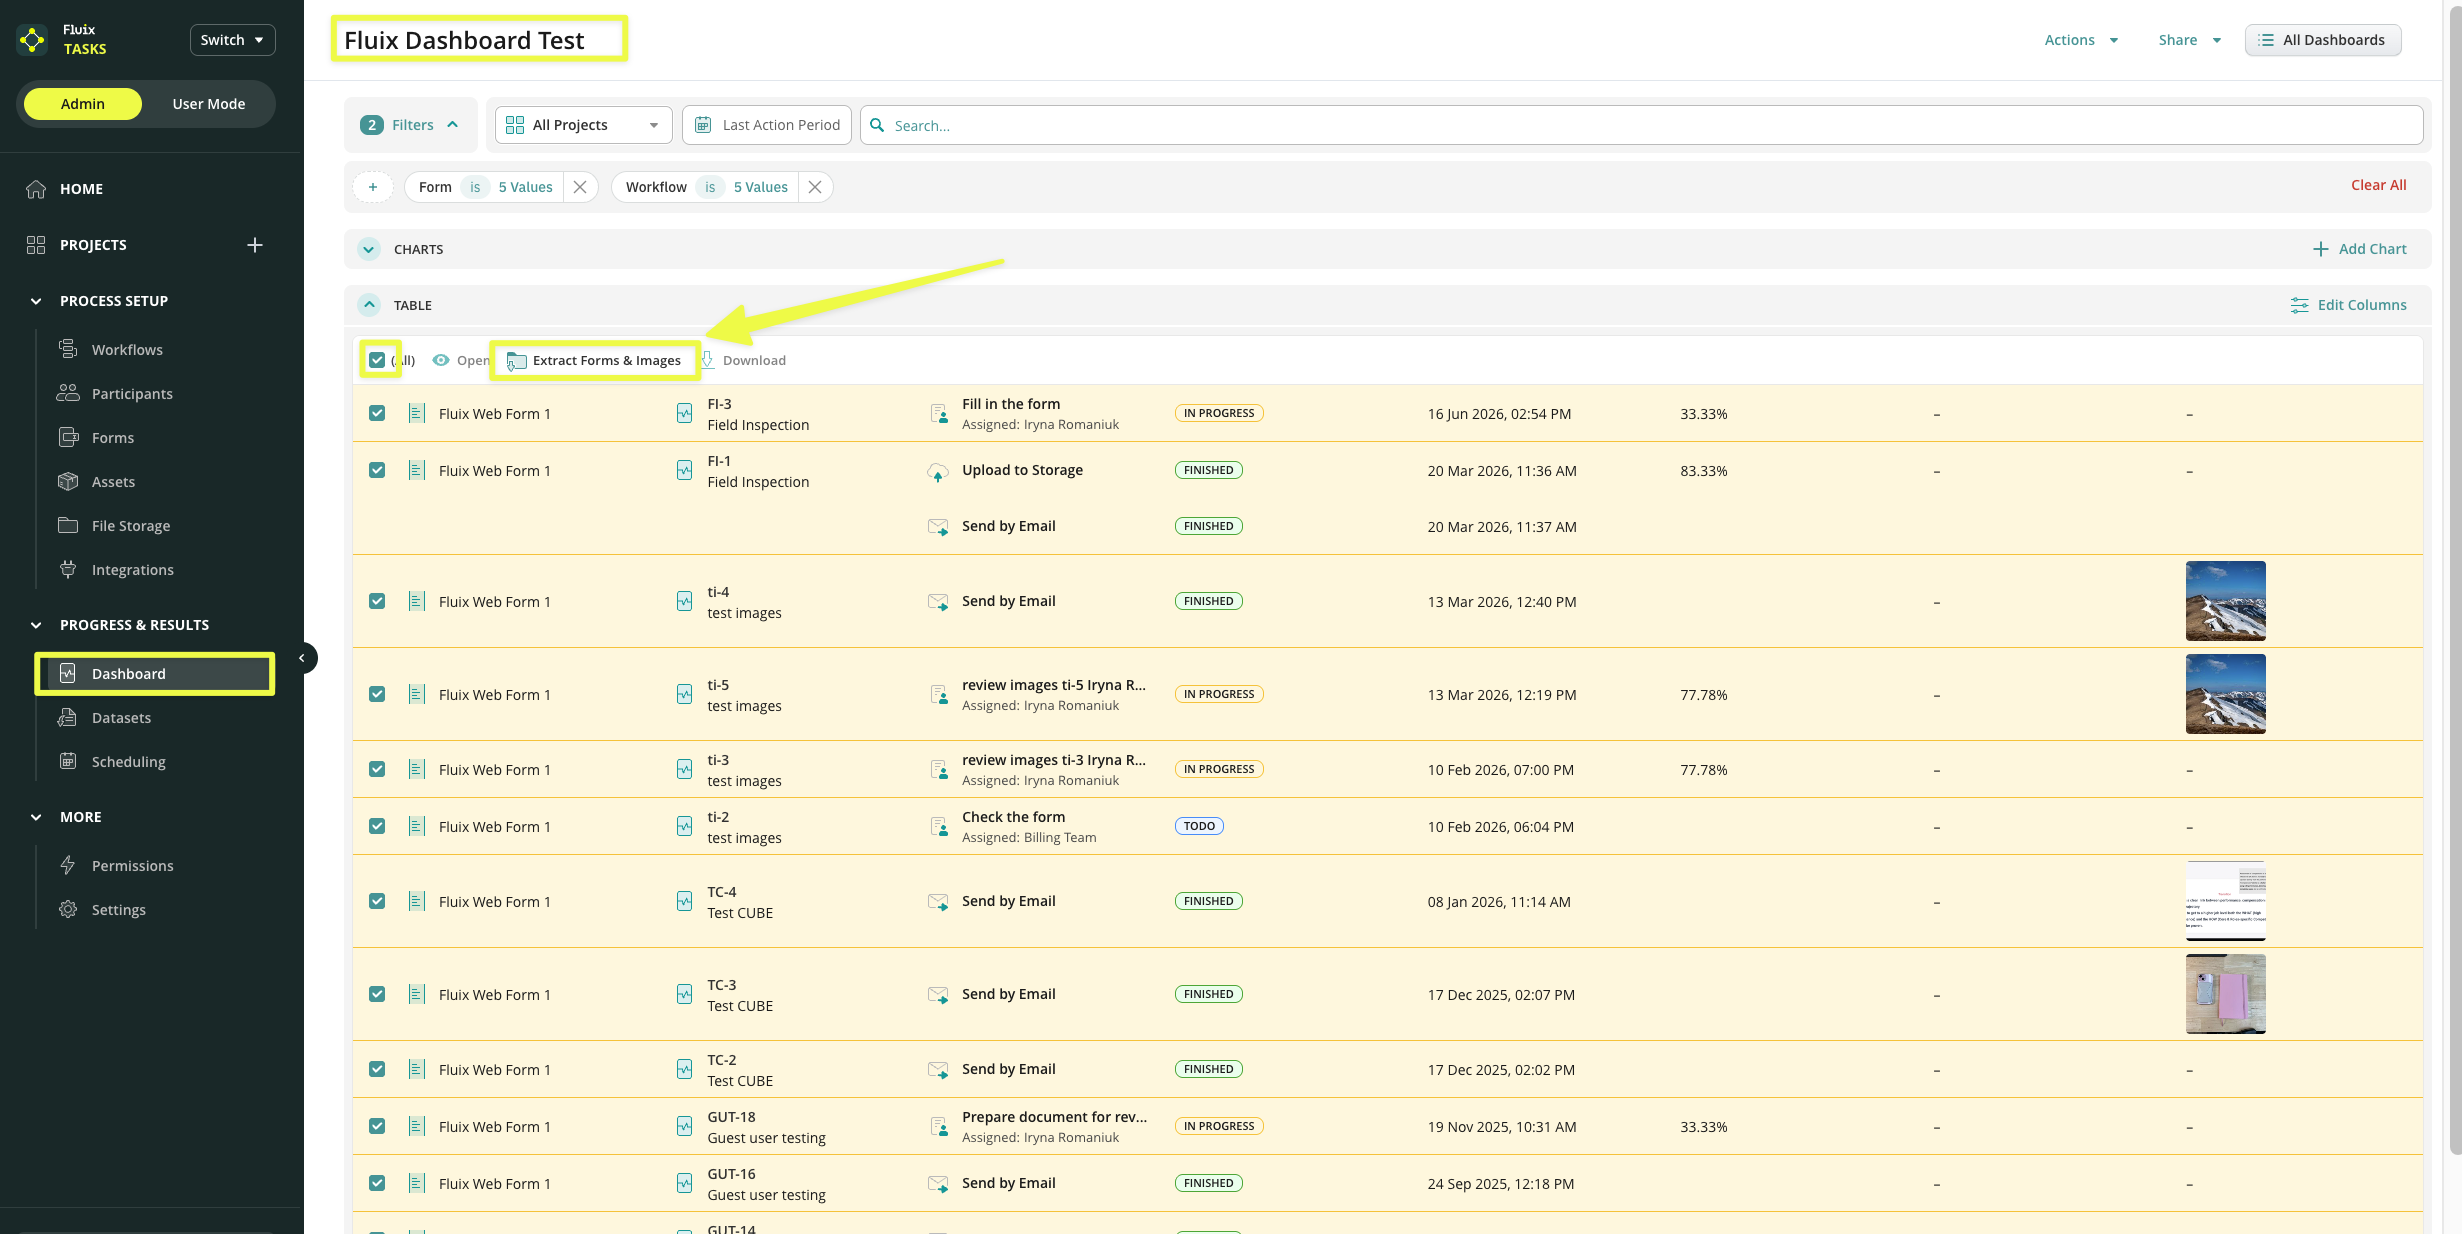
After applying these changes, you will see the image preview in the Dashboard where you saved the changes. Additionally, you can quickly Extract Forms & Images here, but we will dive deeper into this in the second part of this article.
How to extract images from tasks in Dashboard?
After you enabled the ‘Show image Thumbnails’ option in the instructions above, in the ‘Dashboard’ section, check the box next to the process from which you would like to extract images and click on the ‘Extract Forms & Images’ button in the opened panel, wait a few seconds until the file downloads.
In case you have any additional questions about the functionality, contact us at support@fluix.io to learn more about it.
Was this article helpful?
Thanks for your feedback!
Oops, something went wrong. Please, try again later.
Thank you!
What details or examples would have made this article more helpful for you? We appreciate your insights!
Sign Up to Our Product Newsletter
The latest updates from our Product team, straight to your inbox