


In the Reports section, by opening your report and clicking the Modify button, you can build or edit your report tailored to your business needs and requirements. Analytics combines two sources: your forms and Fluix system data to generate detailed, customized reports.
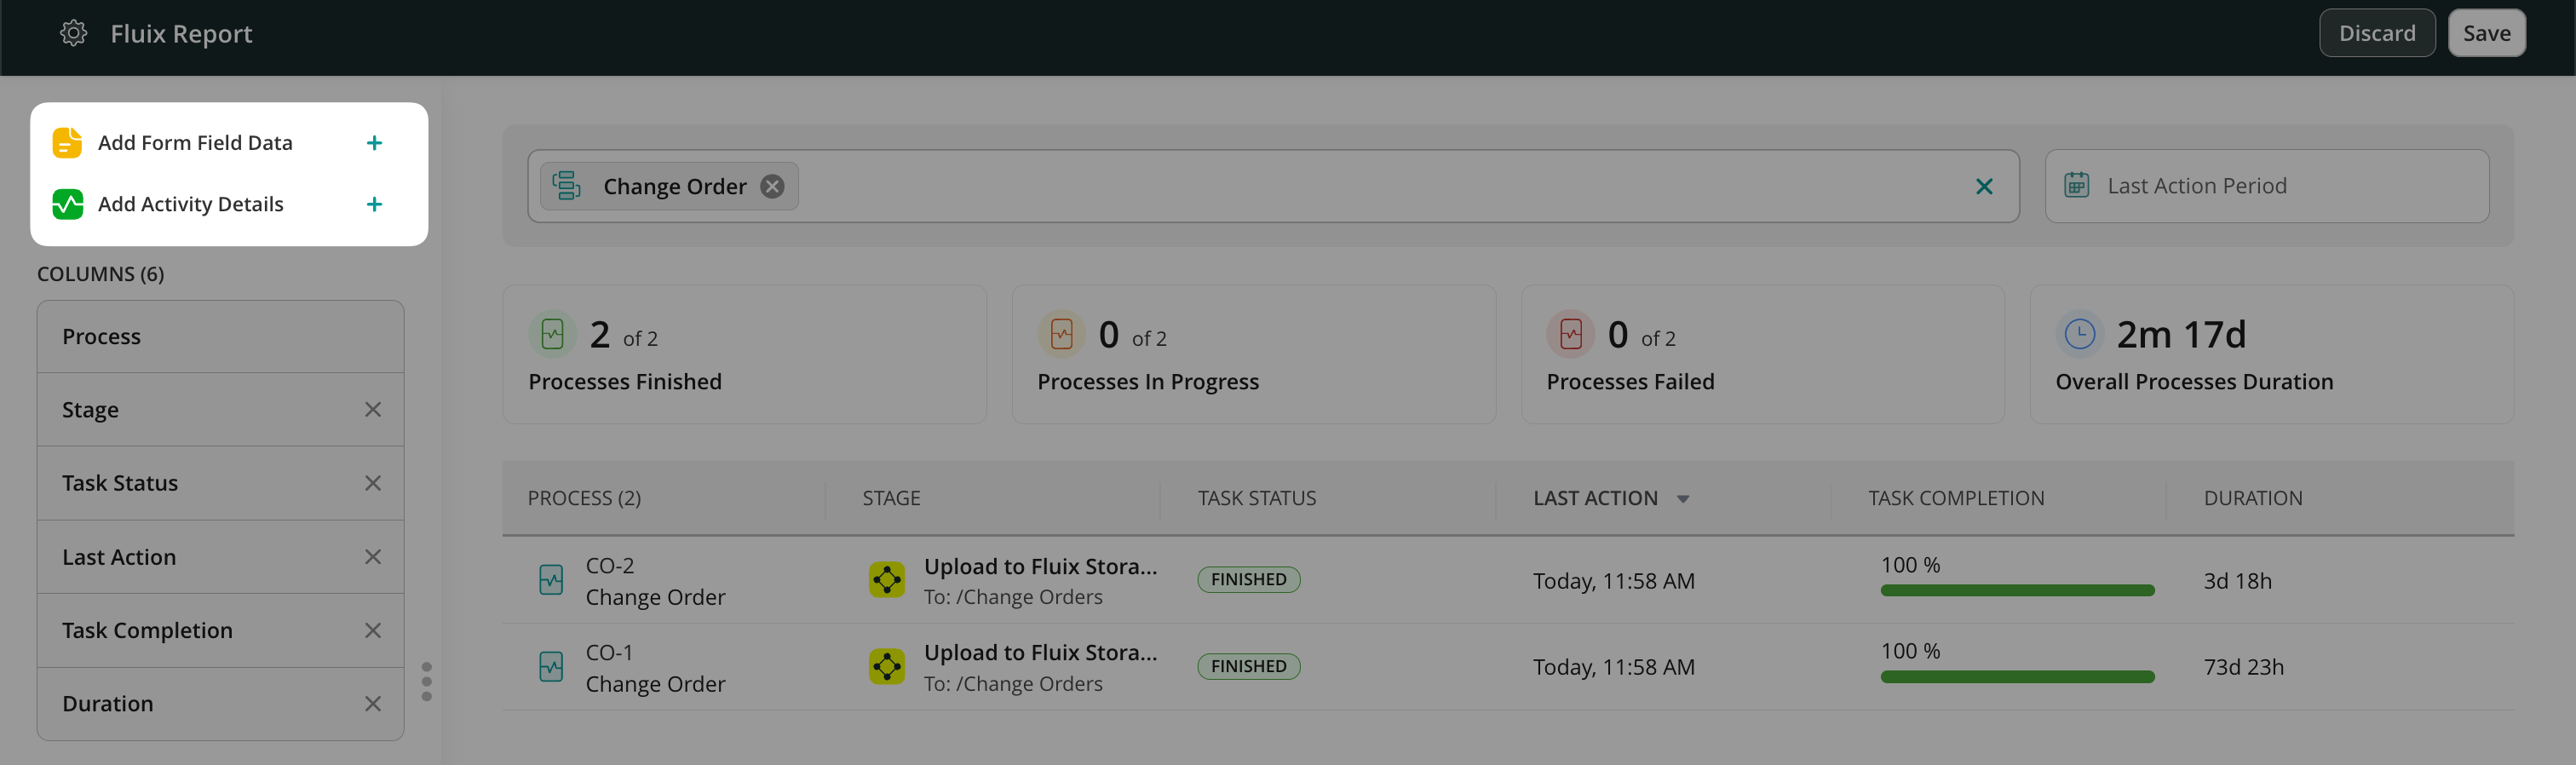
In the Reports Builder, in the top left corner, there are two options for data that you may extract for your report:
- Add Form Field Data: Select fields from your forms assigned to the workflows to analyze the current trends and submissions from your field team.
- Add Activity Details: Add system data like the due date, current assignee, task duration, etc.
You may delete the columns no longer needed or move them by dragging them over. The number of columns you can add to the report is unlimited. The data that can be added is filtered into separate sections, such as General, which contains basic information about the tasks; Performers, which mainly contains information on who worked or is working on a task; Forms; Productivity, etc. Select the parameters you would like to add to your report to see the complete overview of the performance based on your business needs.
Please note: the first column (Process or Form) is added by default and cannot be deleted or moved.
After you select all the needed parameters on the sidebar in the Columns section, click Apply to check the modified report. The Widgets in the Report Builder will automatically pull the data according to the selected parameters.
Once you’ve customized your report, click Save to publish it. The report will appear in the Reports section and automatically update with new data each time your team submits related tasks in the Fluix app.
We have also introduced Charts, a new functionality that helps turn report data into clear visual insights. Charts are built based on Reports and allow you to visualize trends, compare performance, and better understand your data without manual analysis. Learn more about Charts in this article.
In case you have any questions or difficulties with setup, contact our support at support@fluix.io and we’ll be happy to help you.