


Business process maps, often referred to as process diagrams, are visual representations that show how a business or organization carries out its operations. Different types of process mapping help understand, optimize and streamline the company’s processes.
In the corresponding guide, you can find more details on the concept and definition of business process mapping.
And in this article, we’ll explore the most common types of process maps that can be used individually or in combination, depending on the goals and complexity of your processes.
12 Types of Process Maps
There is no finite number of process map types, as the classification can vary based on evolving tech capabilities and the vision of creators.
Each type serves a specific purpose, and the choice of which one to use depends on factors such as the process stage, the audience, the goals of the analysis, etc.
Here are twelve most commonly used types of process maps that reflect the diverse needs, and perspectives that organizations have when analyzing their operations.
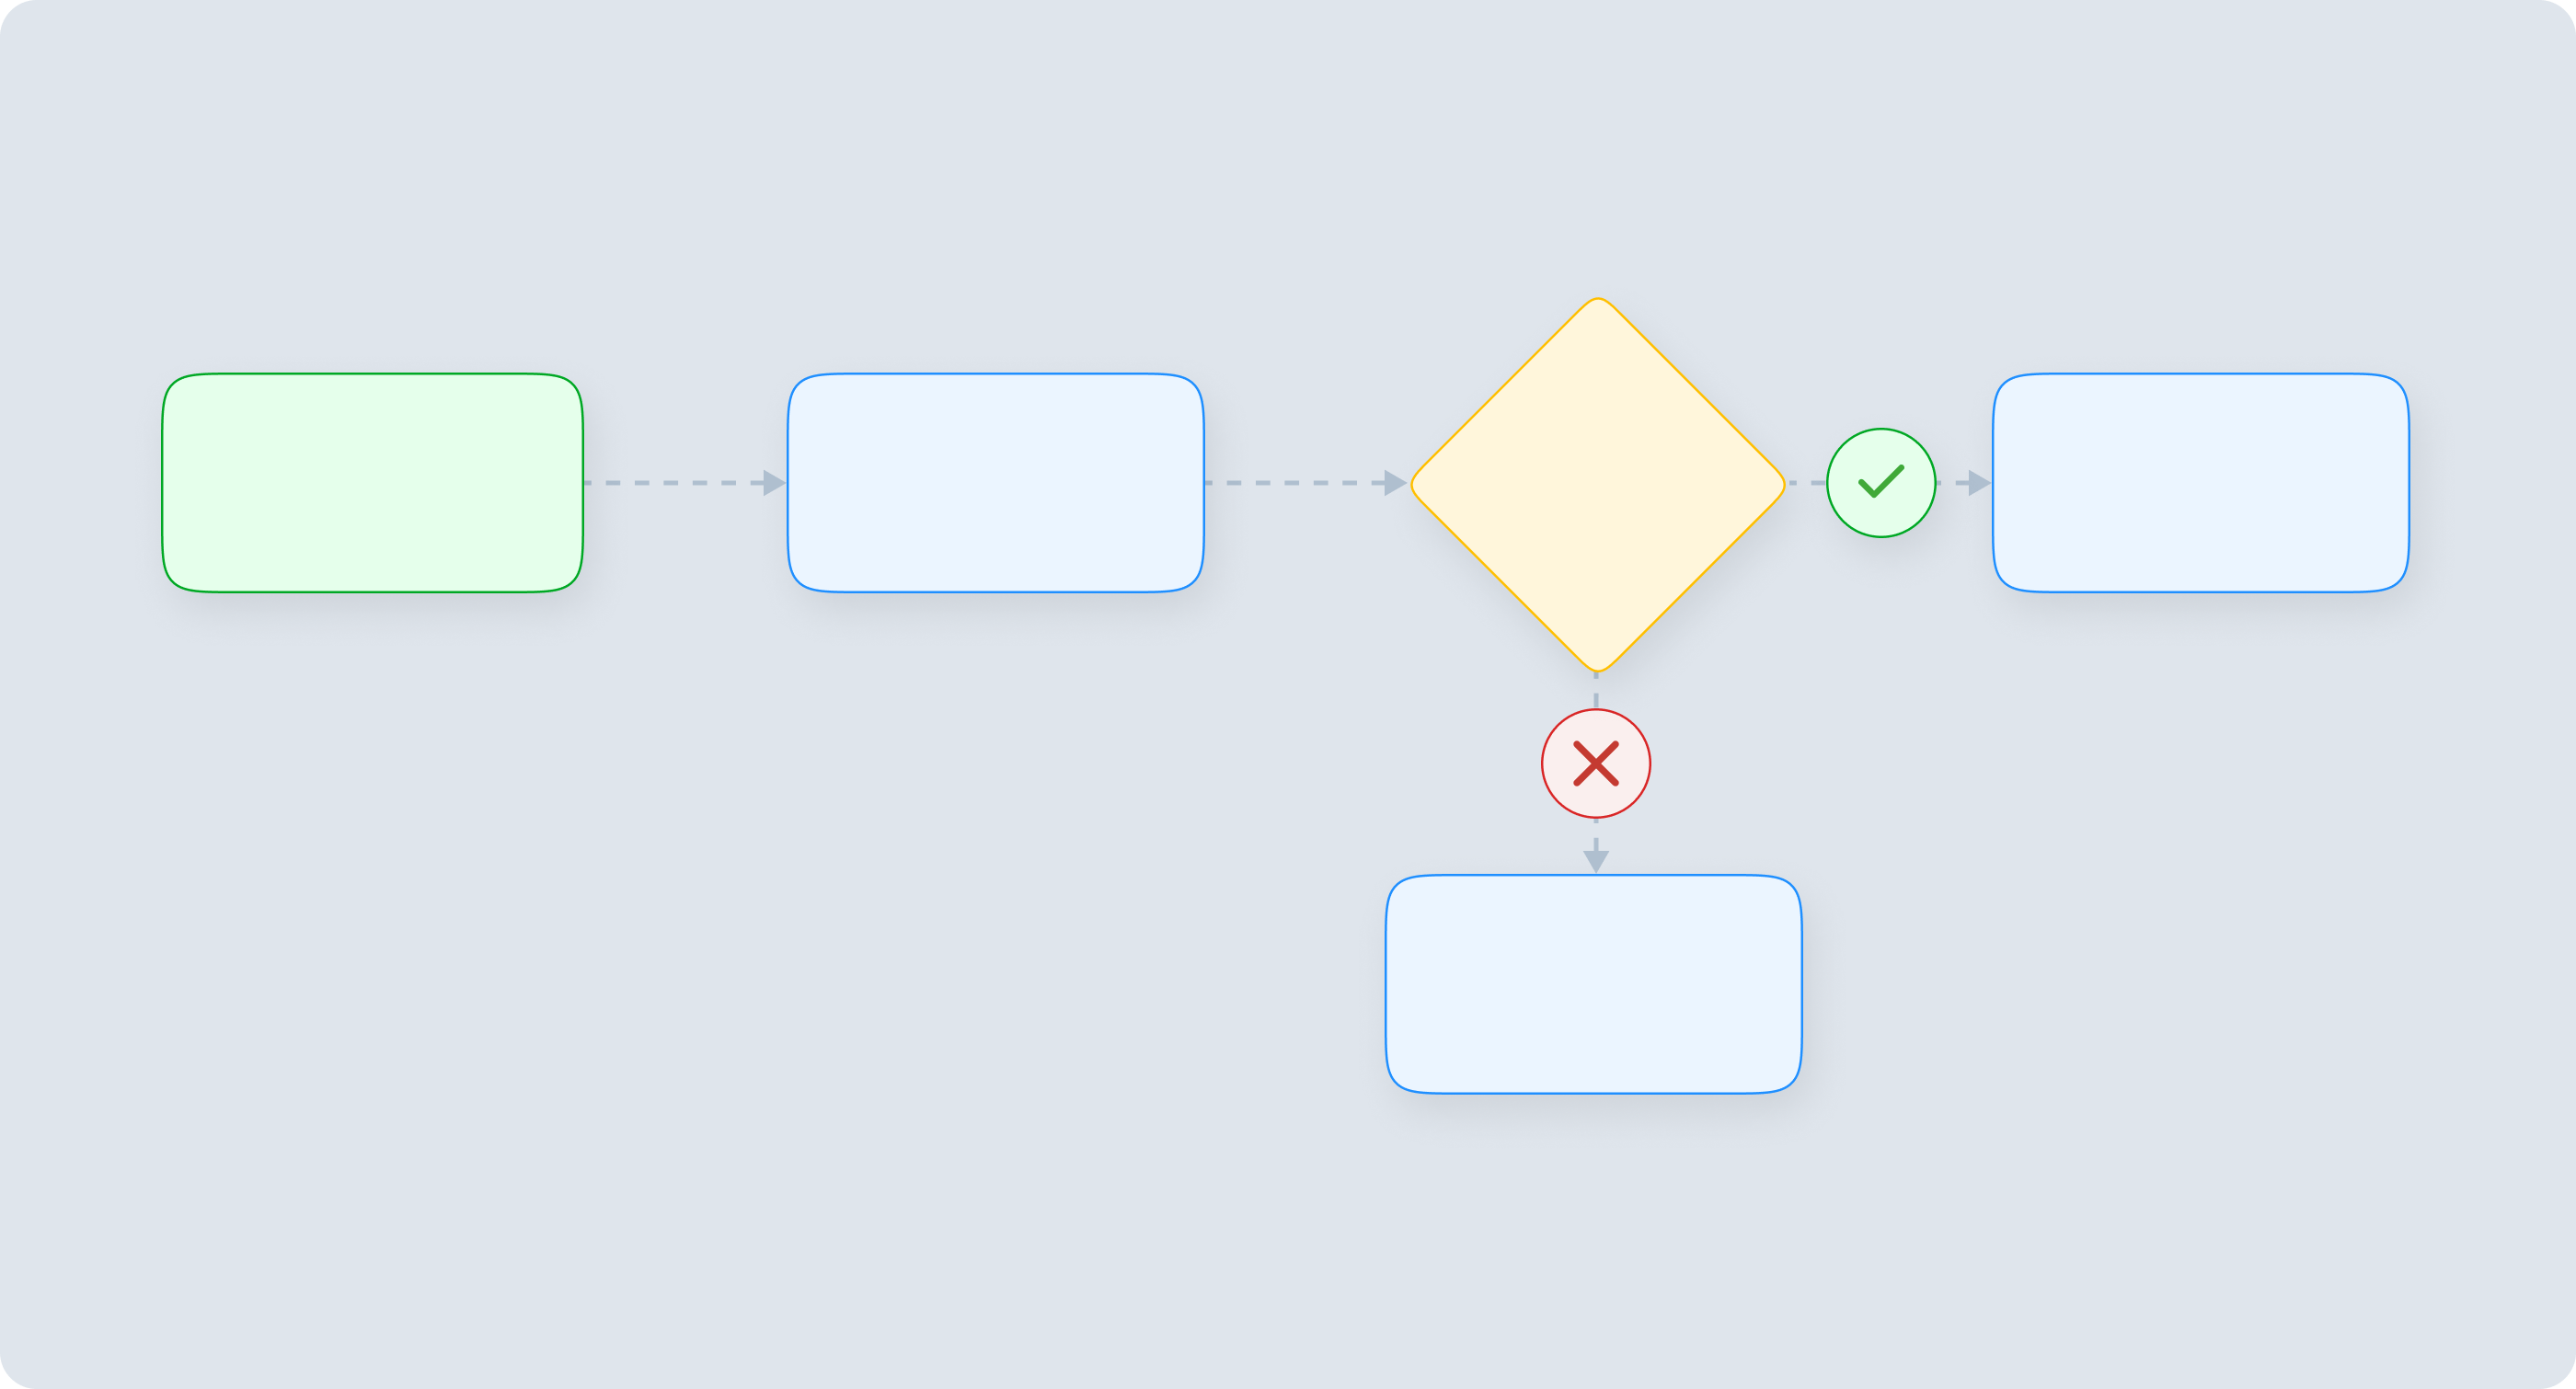
1. Flowcharts
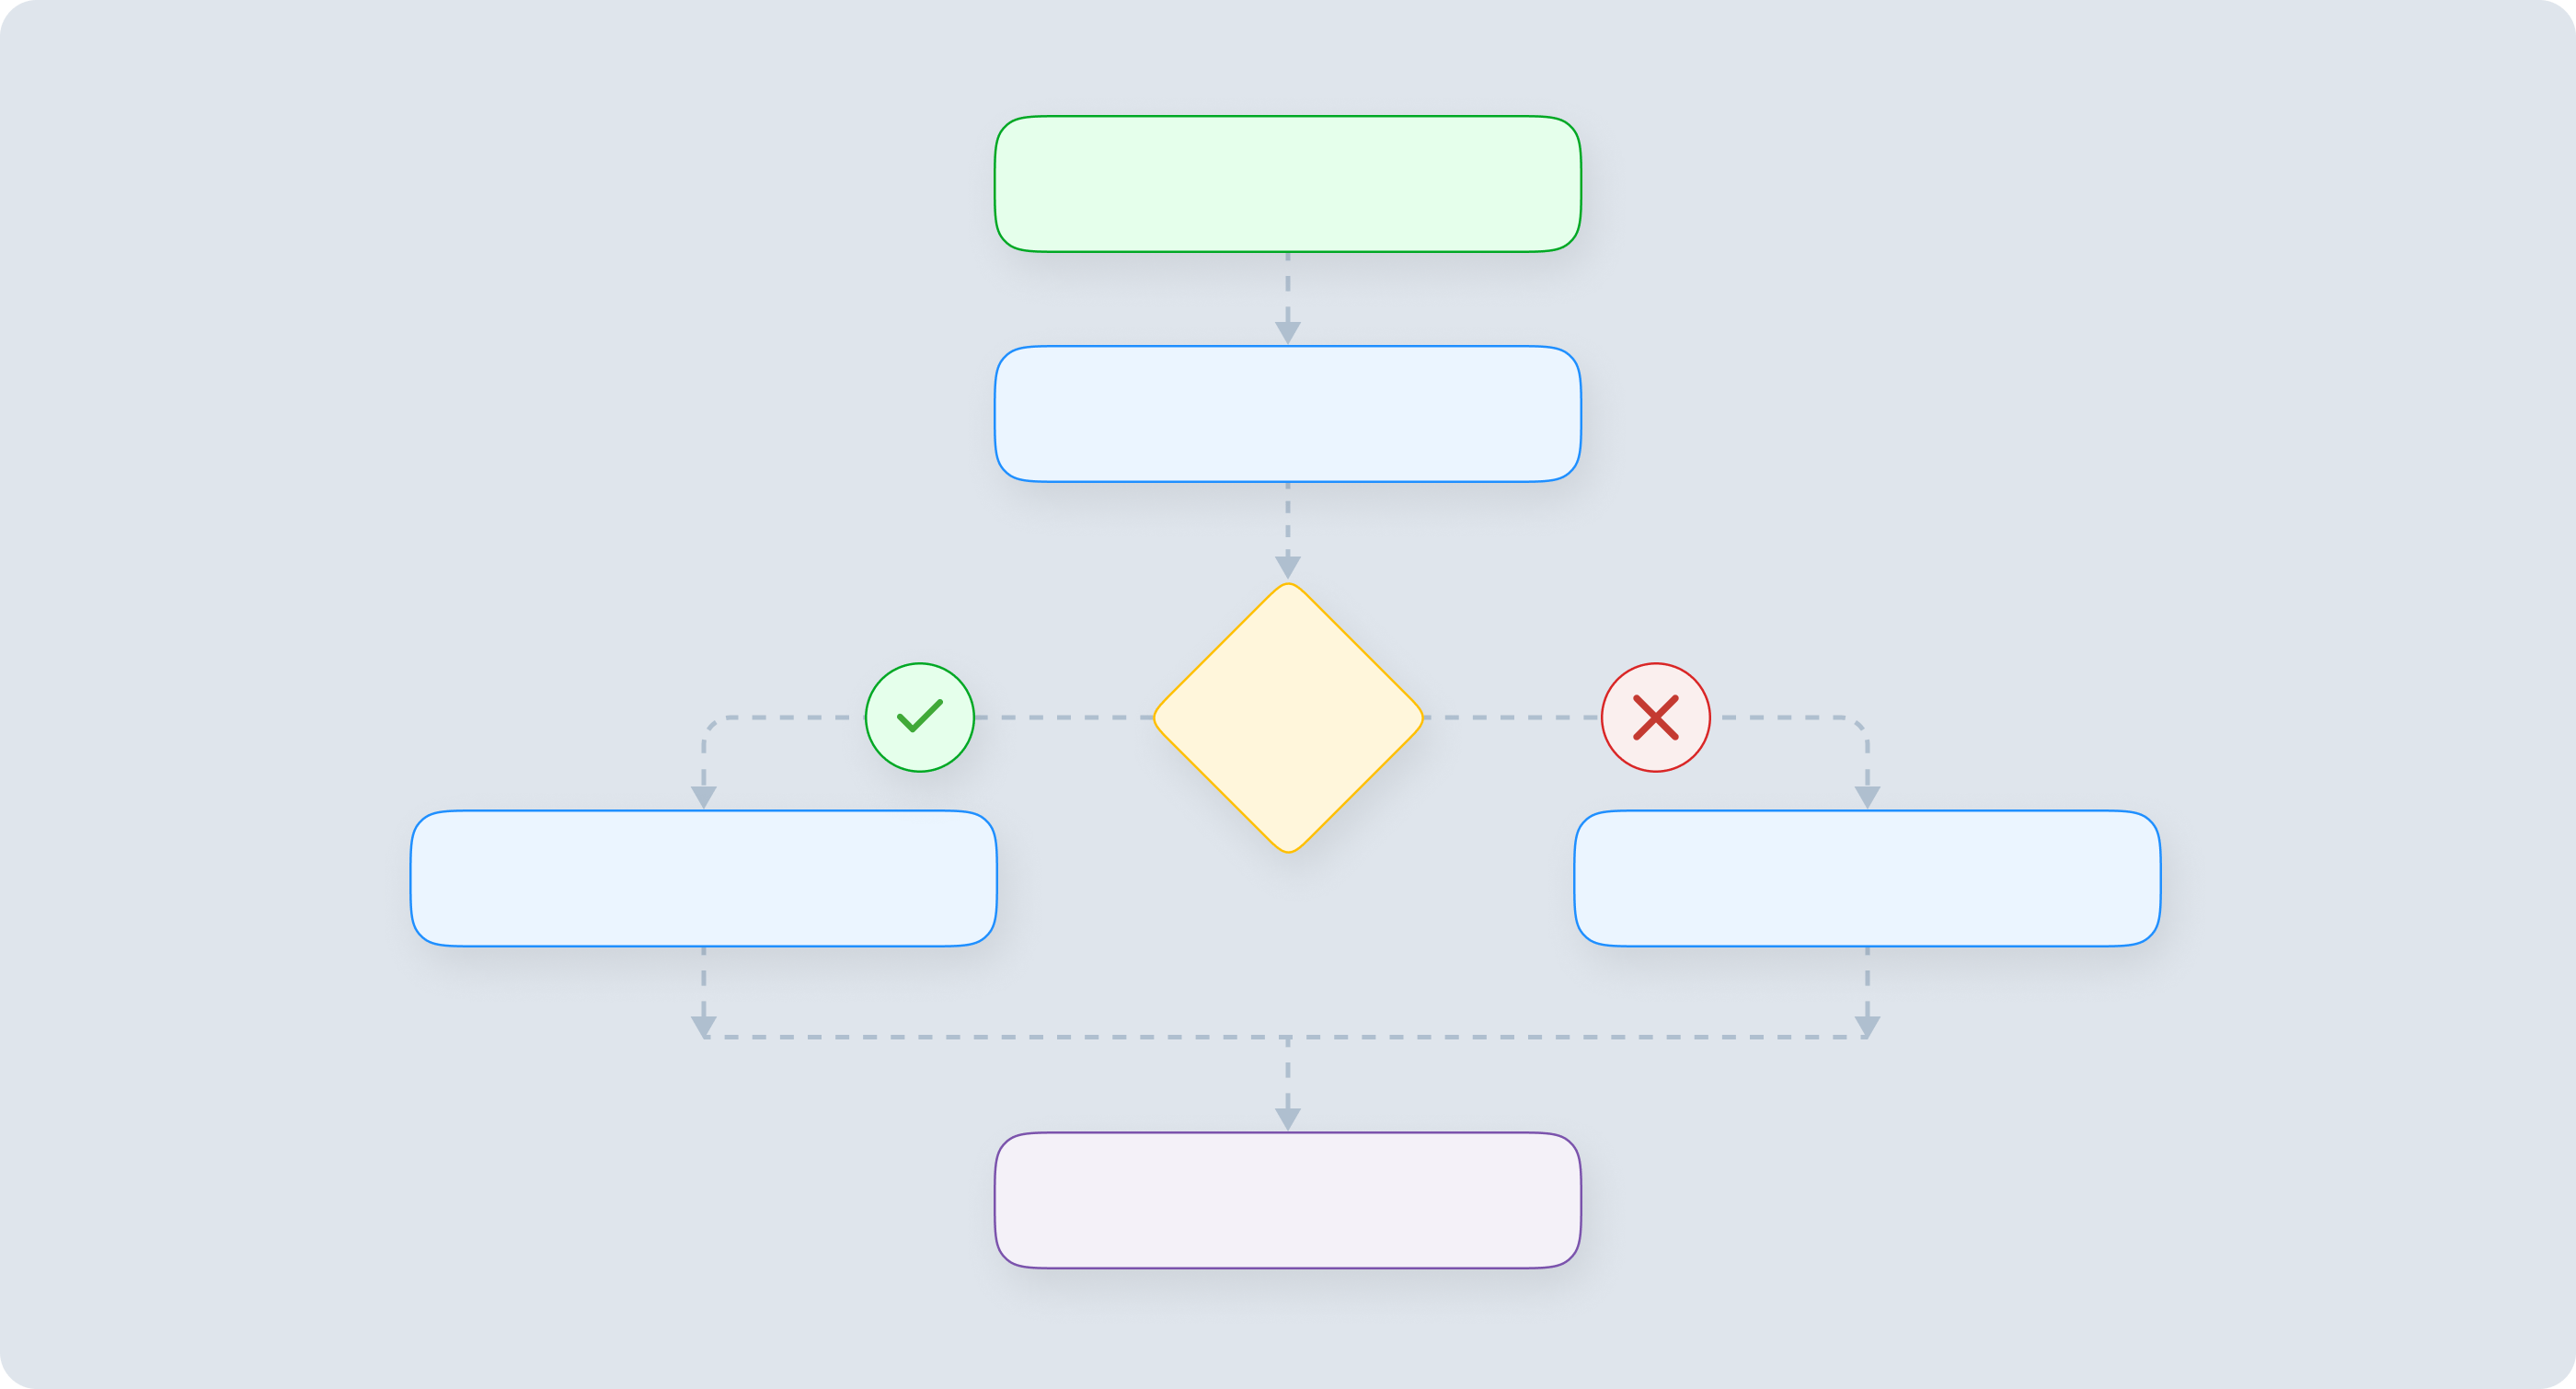
Flowcharts are one of the most widely used process map formats. This diagram uses a collection of symbols and lines to illustrate the sequential steps of a process. Each symbol represents a specific action or decision point, connected by lines that indicate the flow of information or materials. Go to this guide for more detailed information on basic and advanced process map symbols.
Flowcharts are excellent for breaking down complex processes into simpler, more manageable components. These types of process maps provide a clear, step-by-step view of the process, making it easy to understand and follow.
Flowcharts are especially helpful for training new employees, planning new projects, identifying bottlenecks and optimizing workflows. To refine your company’s user experience, try walking through the customer journey in the form of a flowchart.
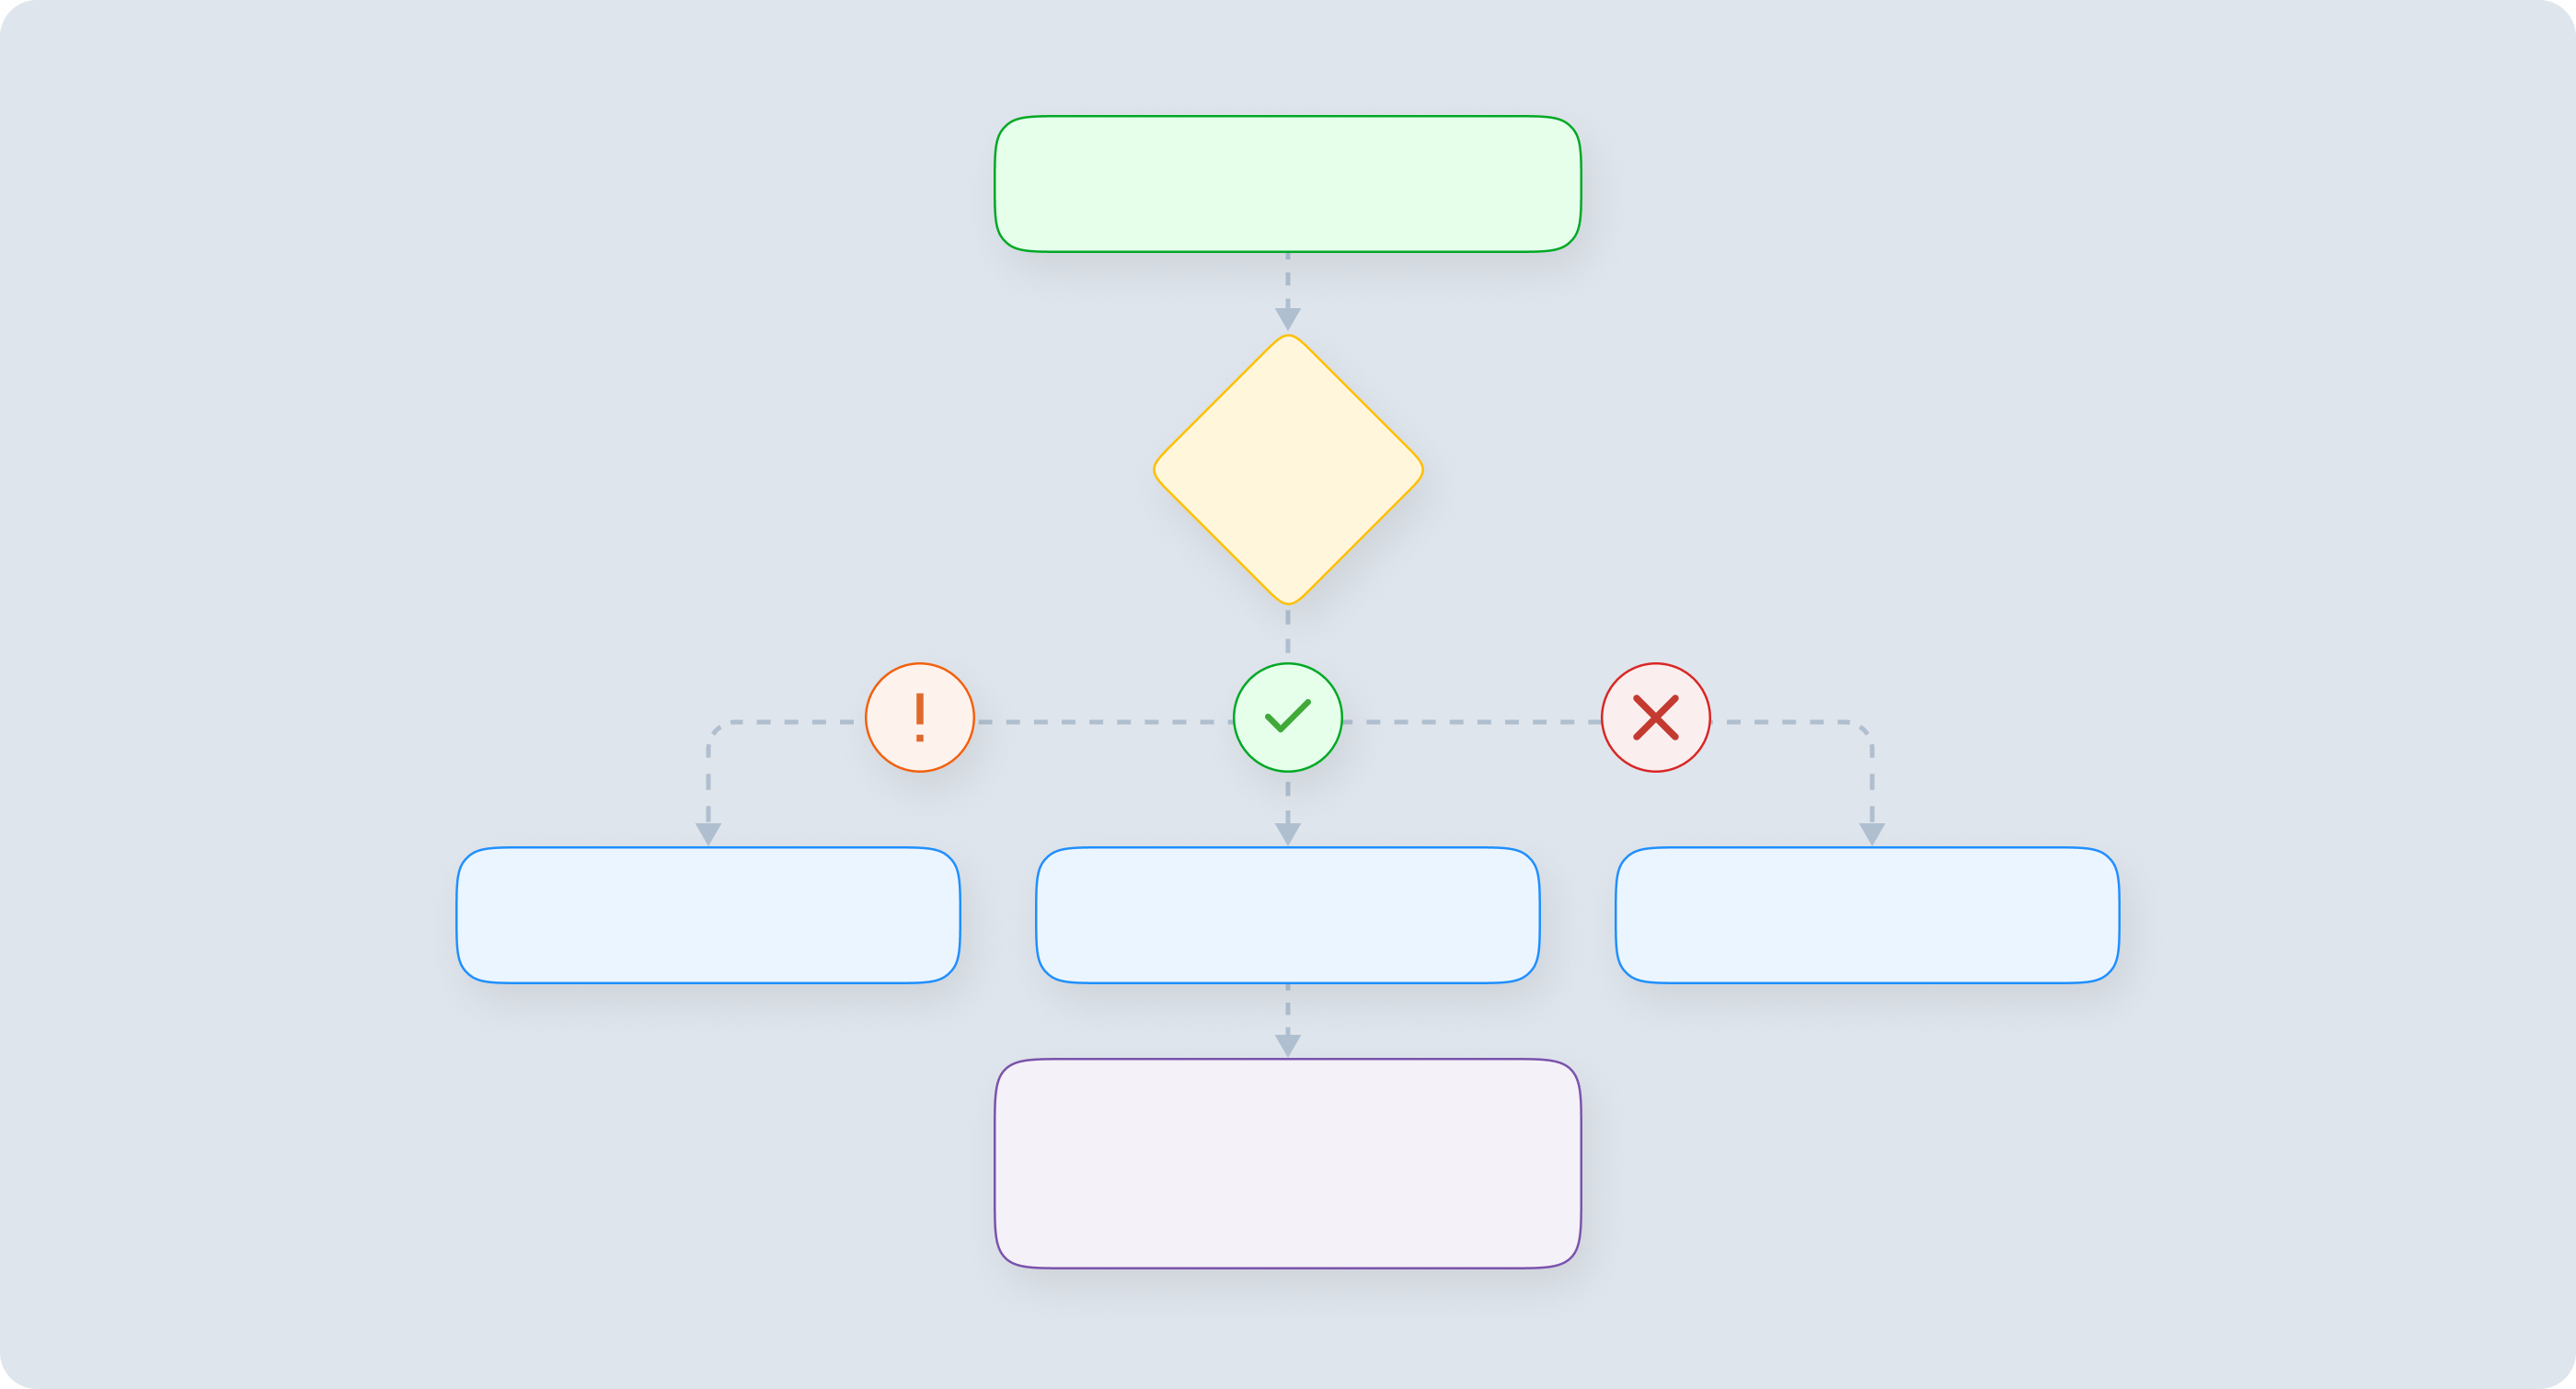
2. Swimlane Diagrams
These diagrams clarify ownership roles within a process. Swimlane diagrams are similar to flowcharts but use multiple rows rather than a single workstream.
Each “swimlane” in the visual map represents a specific department, team or individual. Actions and decisions are displayed within the appropriate swimlanes, providing an instantaneous overview of responsibilities at each step.
Swimlane diagrams help organizations establish accountability, streamline communication and eliminate overlaps and inefficiencies. These types of process maps are particularly useful in cross-functional processes where multiple departments or teams collaborate.
For example, the Six Sigma productivity approach uses swimlane maps ranked by level from zero to four, where zero represents a broad view and four represents a granular diagram that captures even the smallest subtasks.
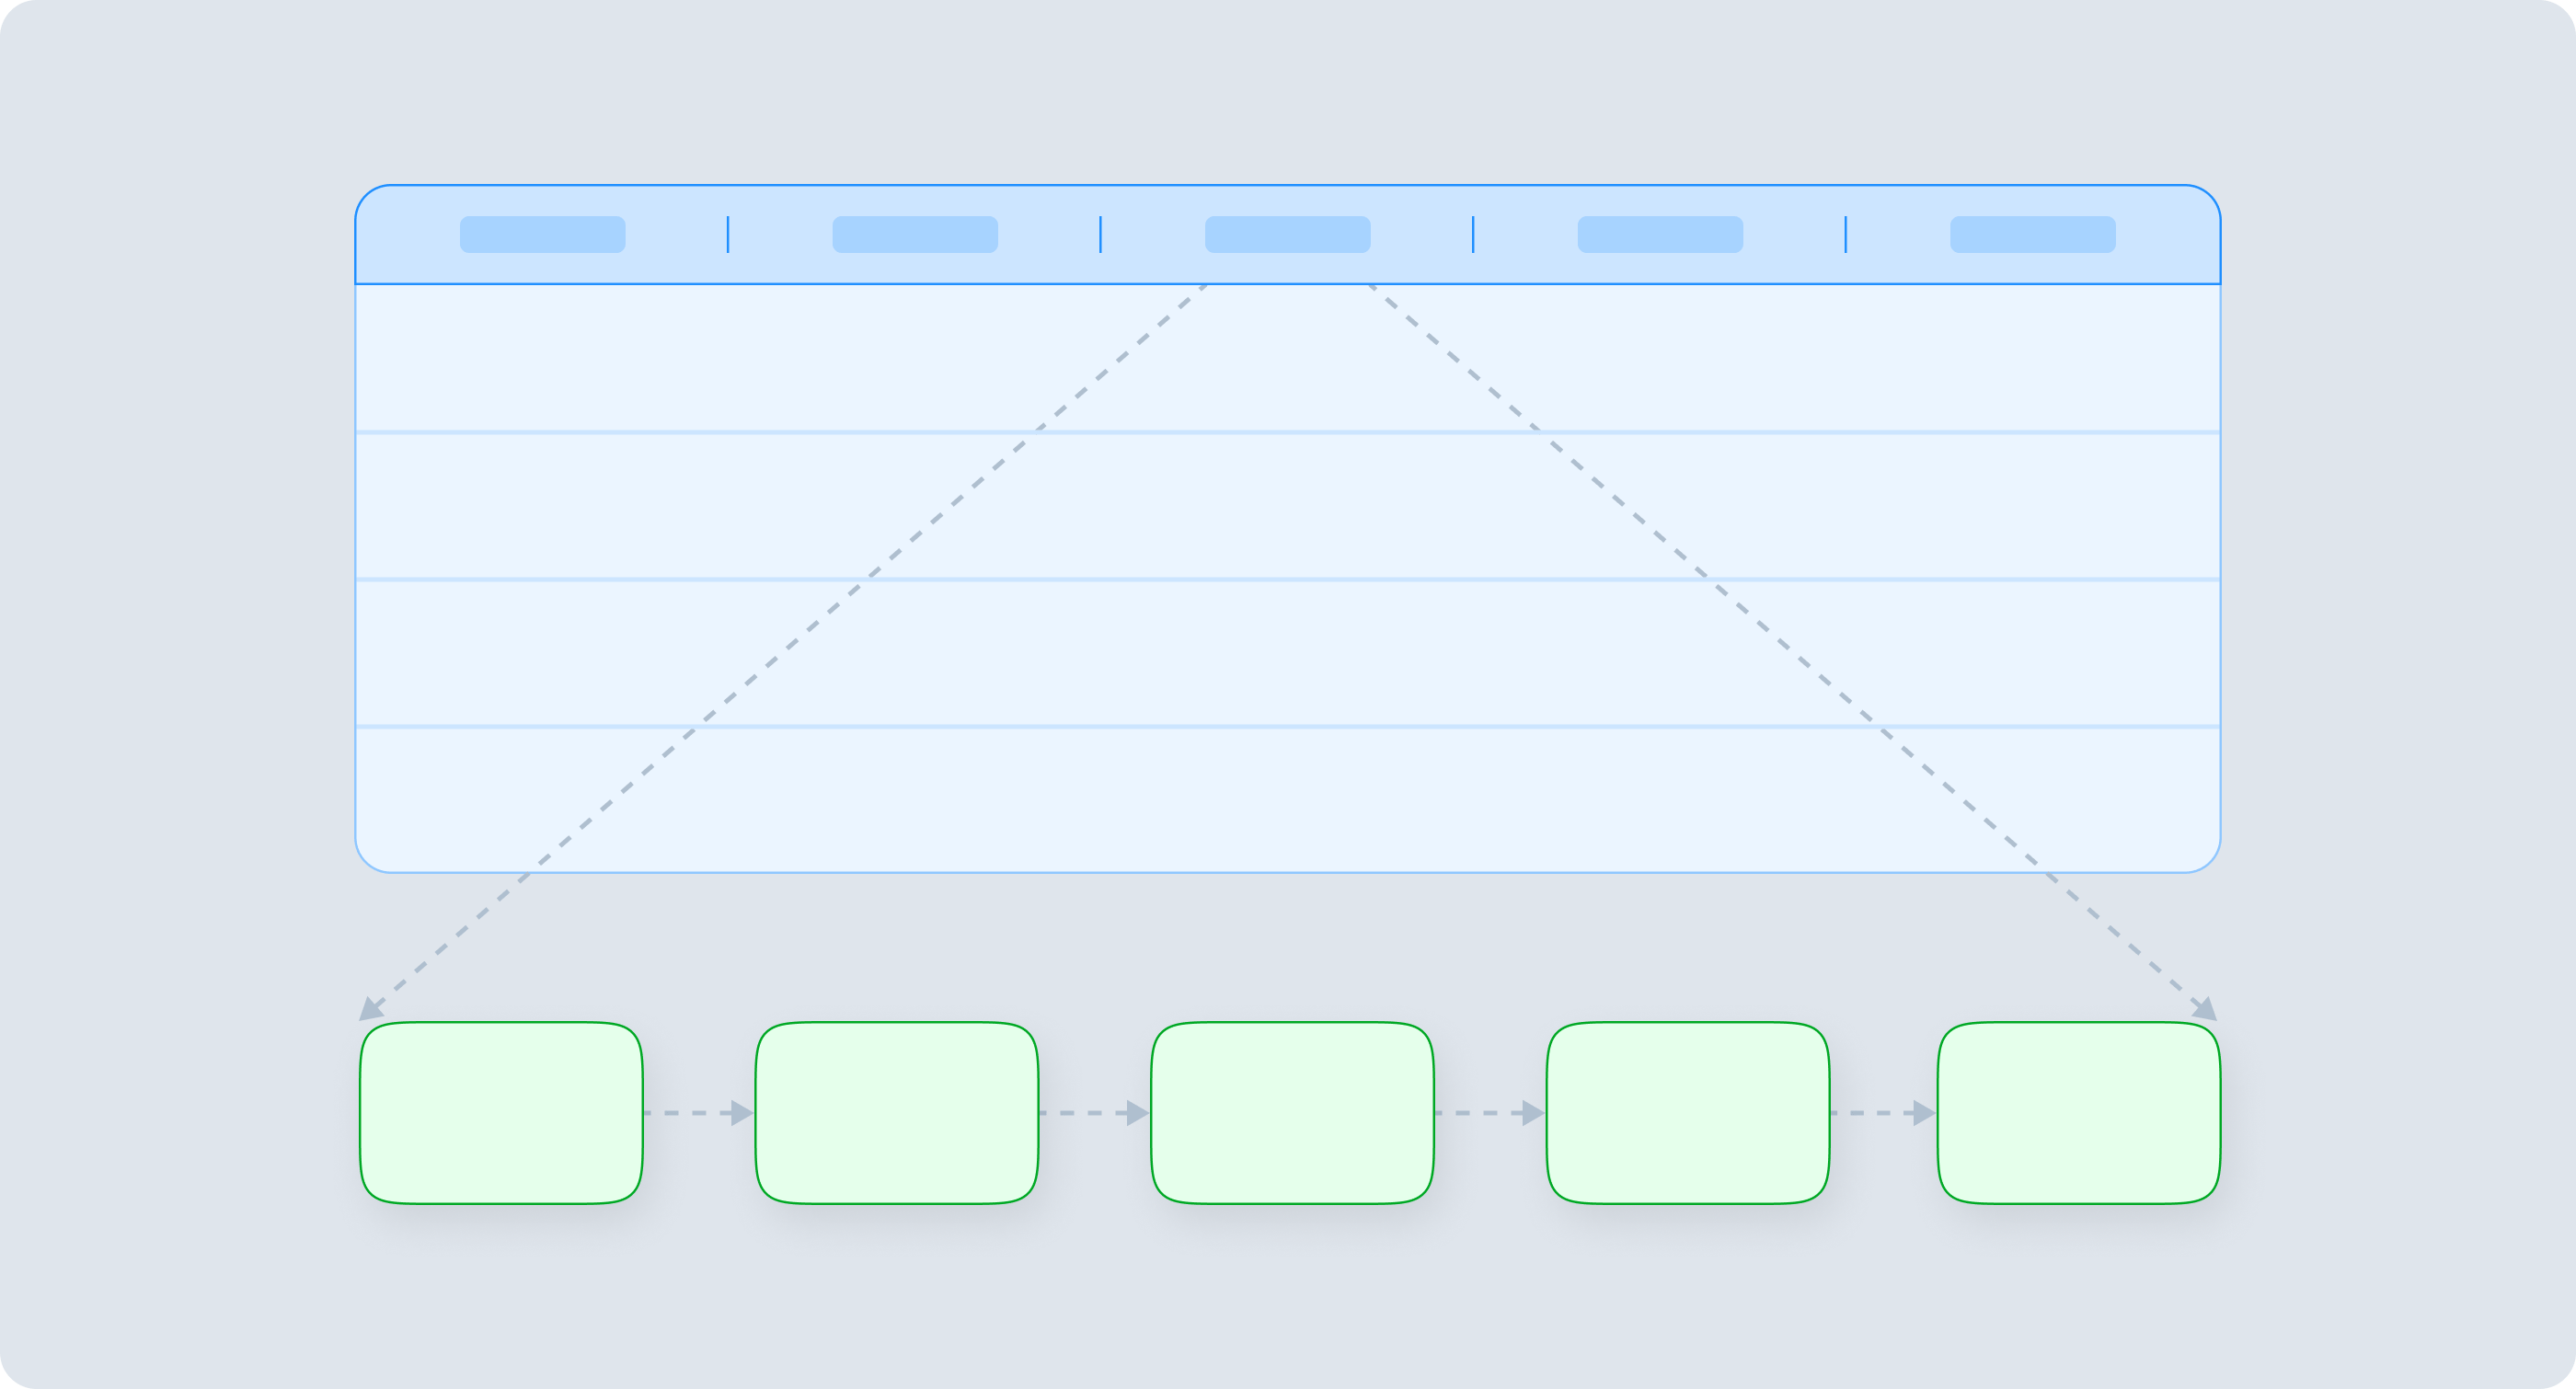
3. Value Stream Maps
You can use this type of map to focus on improving the efficiency and value of a process from a customer’s perspective. Value stream maps detail the entire sales funnel from the initial customer request to the delivery of the final product or service. Along the way, you can analyze available data to emphasize activities that add value for customers and eliminate parts of the experience that don’t engage your users.
By identifying and removing steps that clients don’t perceive as valuable, organizations can streamline their processes, reduce lead times and improve satisfaction with these types of process maps. You can also use value stream maps to decide how to best allocate available resources. They are common tools in lean manufacturing and process improvement initiatives.
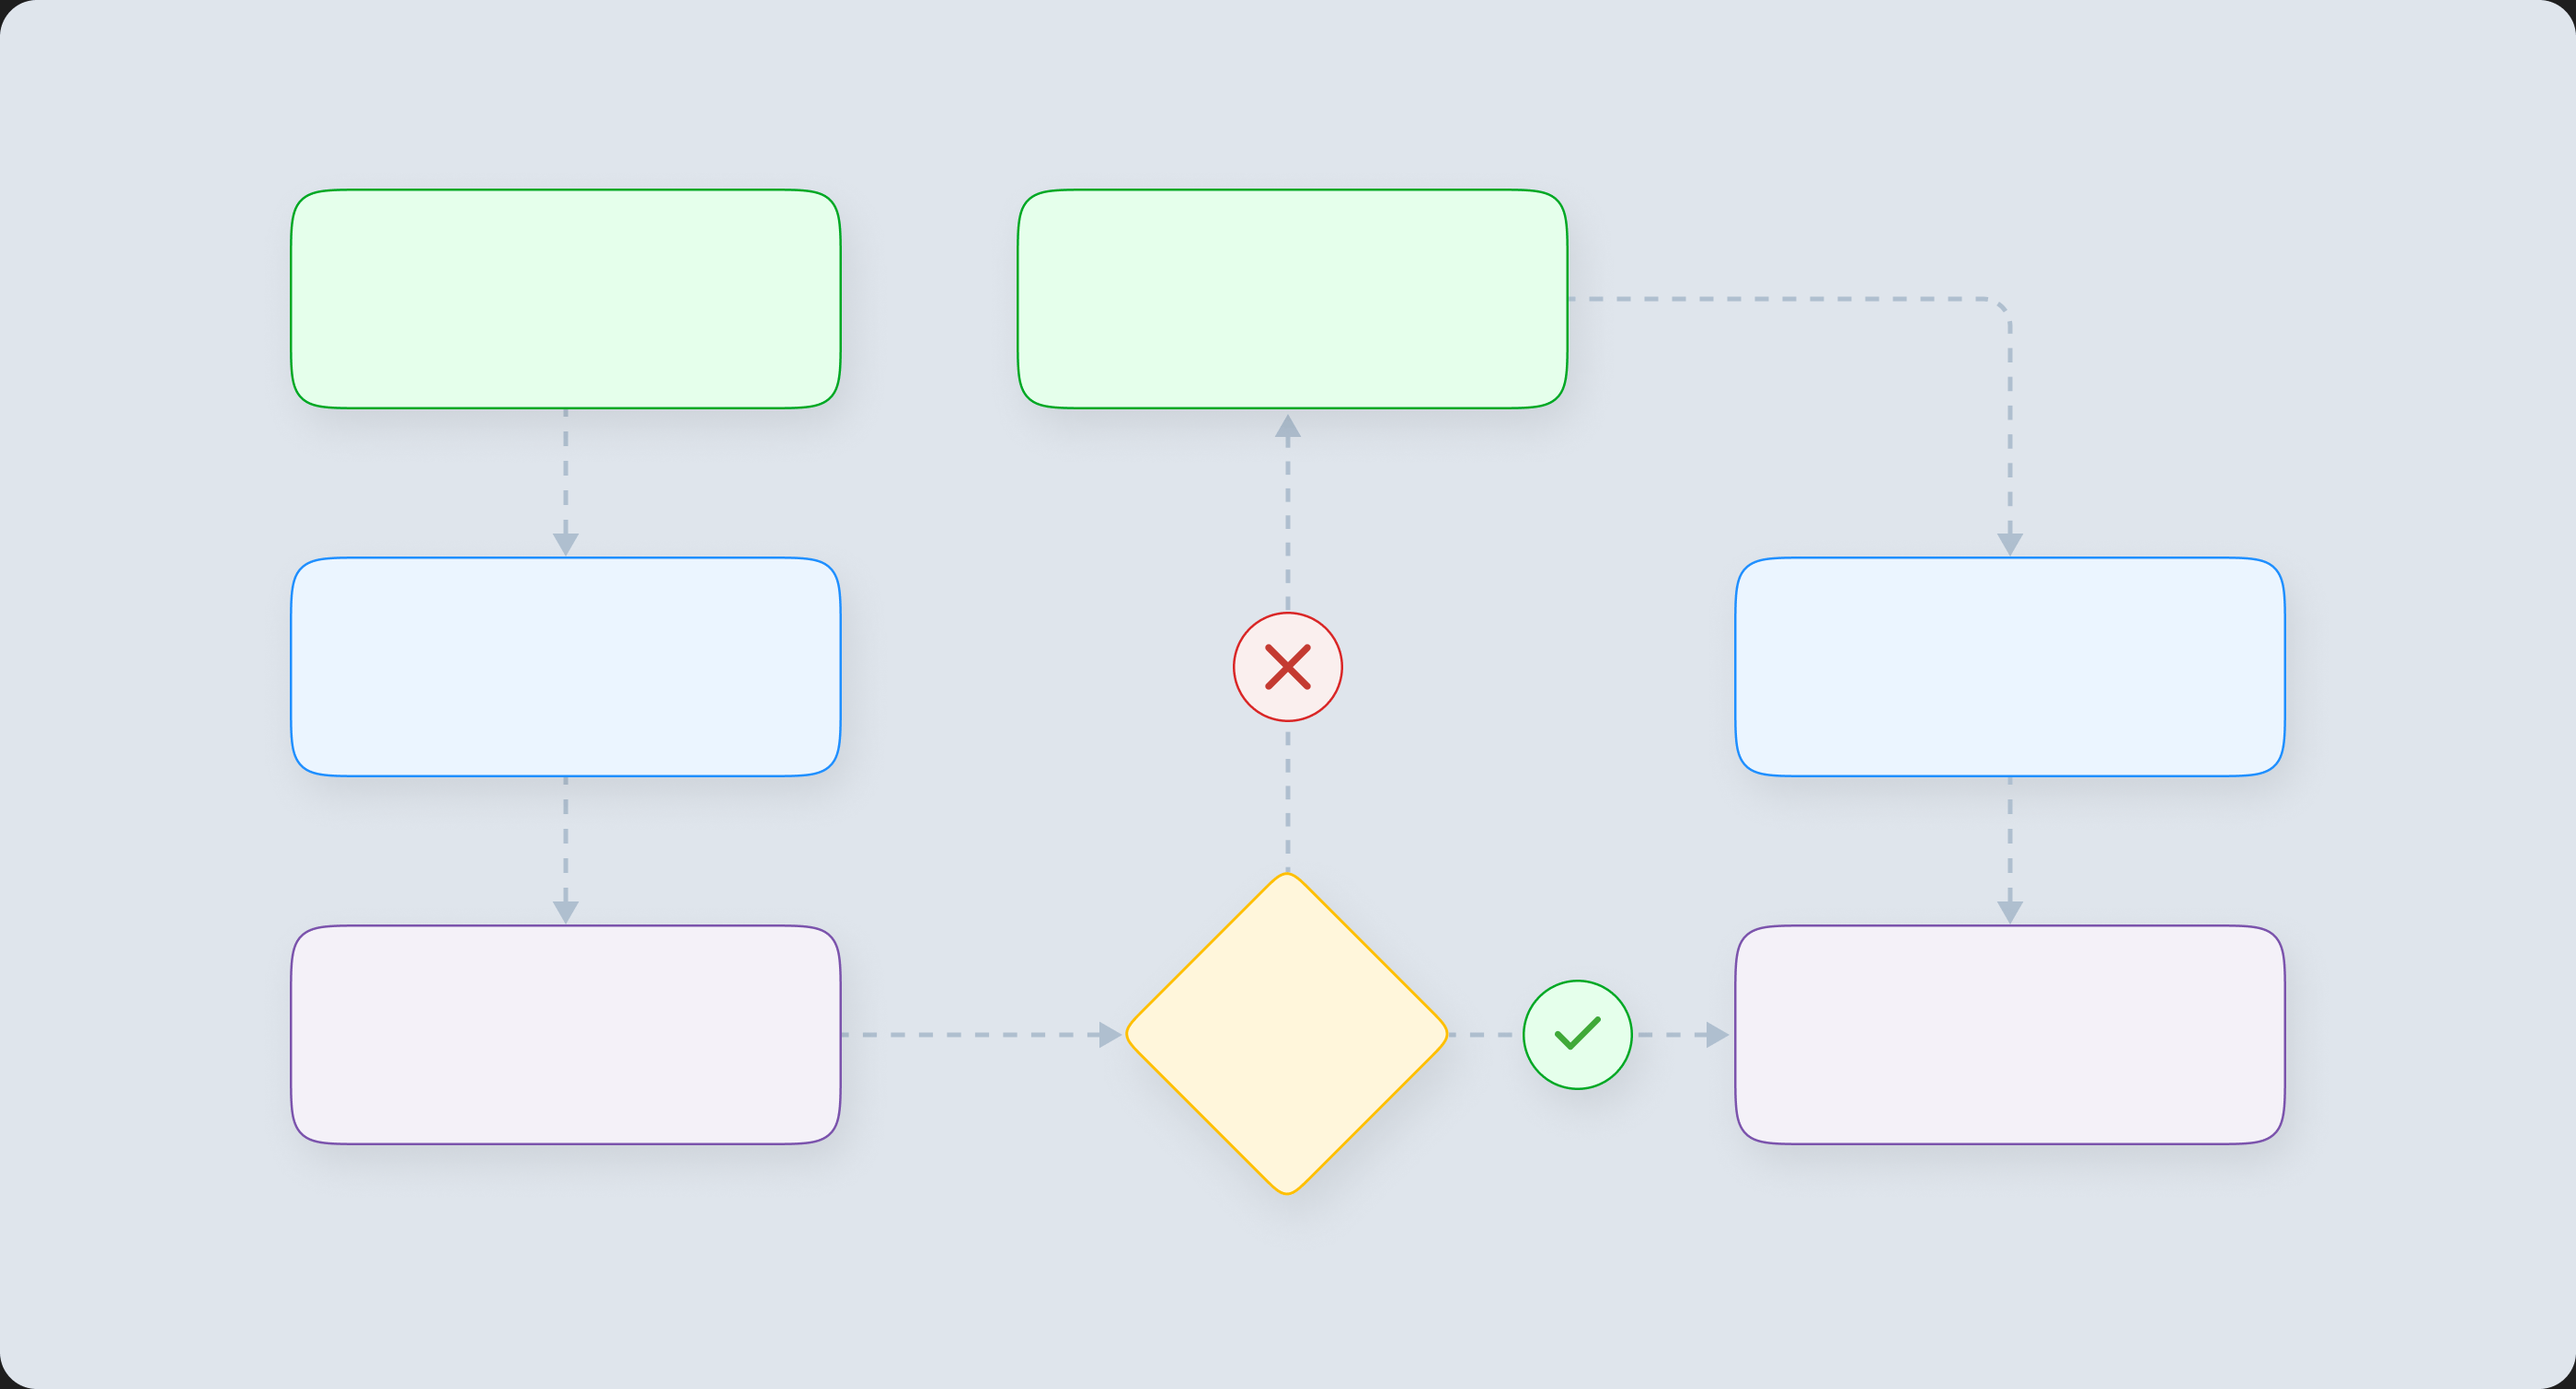
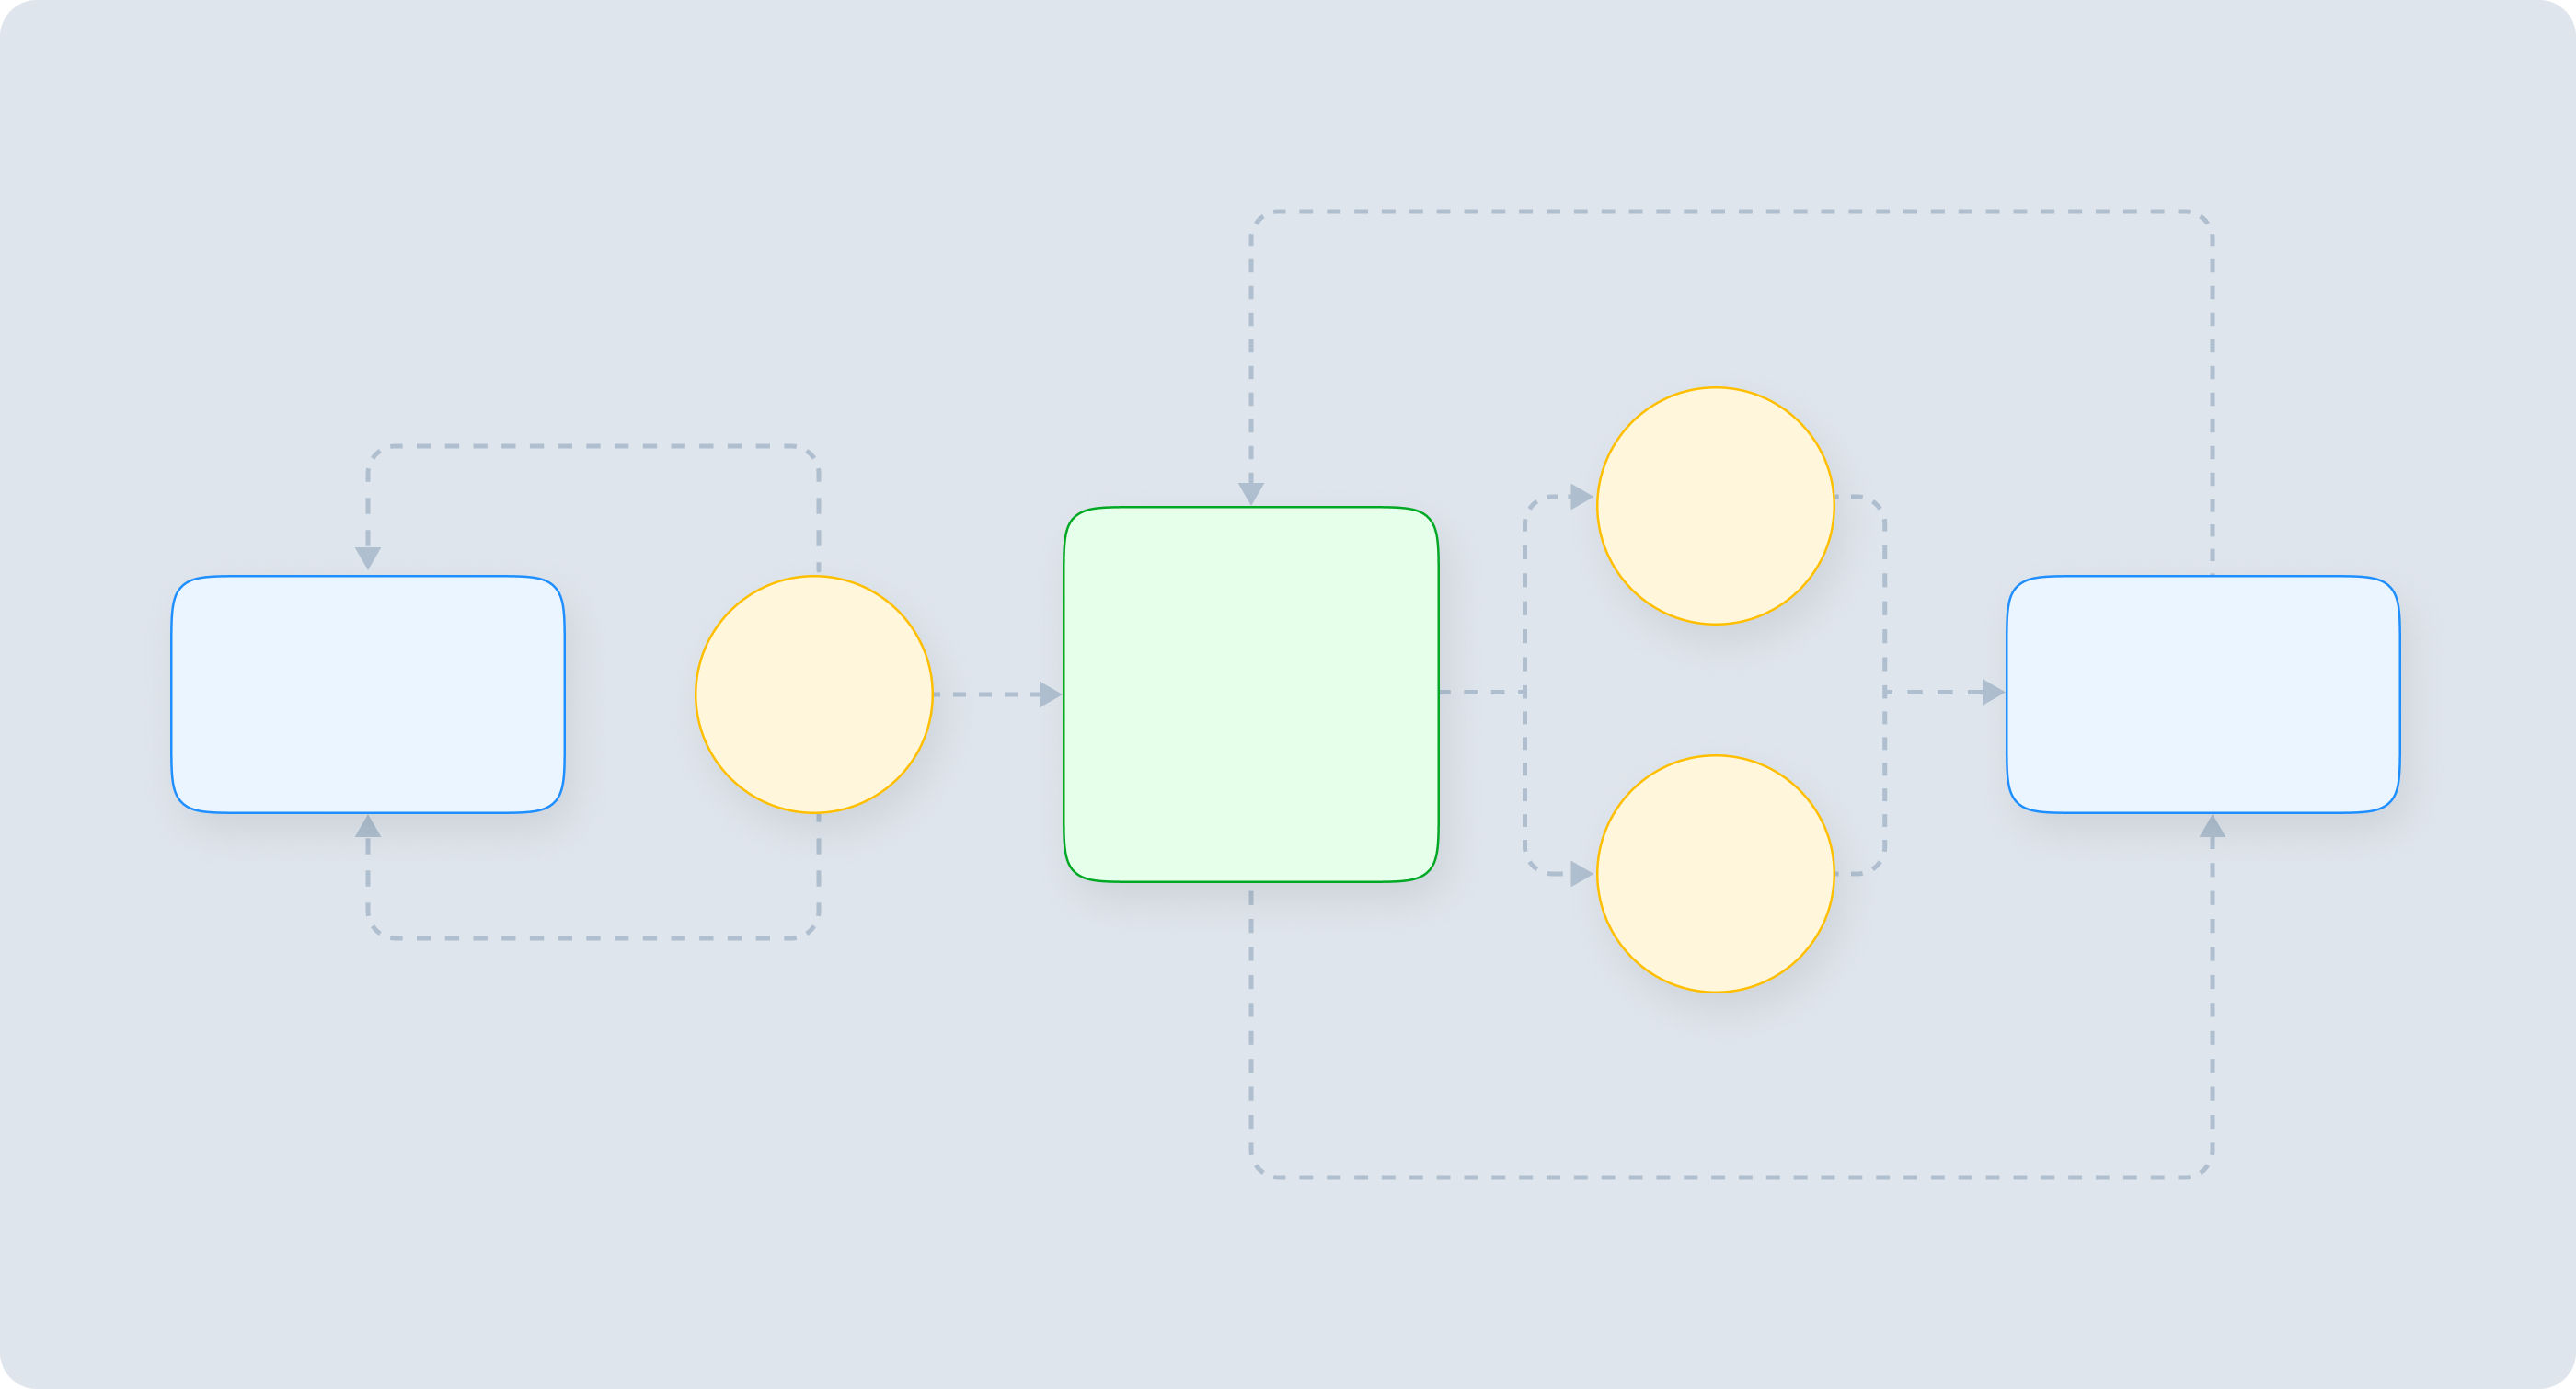
4. Workflow Diagram
A workflow diagram is a type of process map that visually represents the sequence of tasks and activities within a specific process. It illustrates the flow of work through a system, often using arrows to show the direction of the workflow.
Decision points, roles, and responsibilities are typically included to provide a comprehensive view of the process. Workflow diagrams emphasize the sequential order of tasks and can be used in various contexts, such as project management or business process management.
How technicians at RWE Renewables reduce daily form completion time by 45%

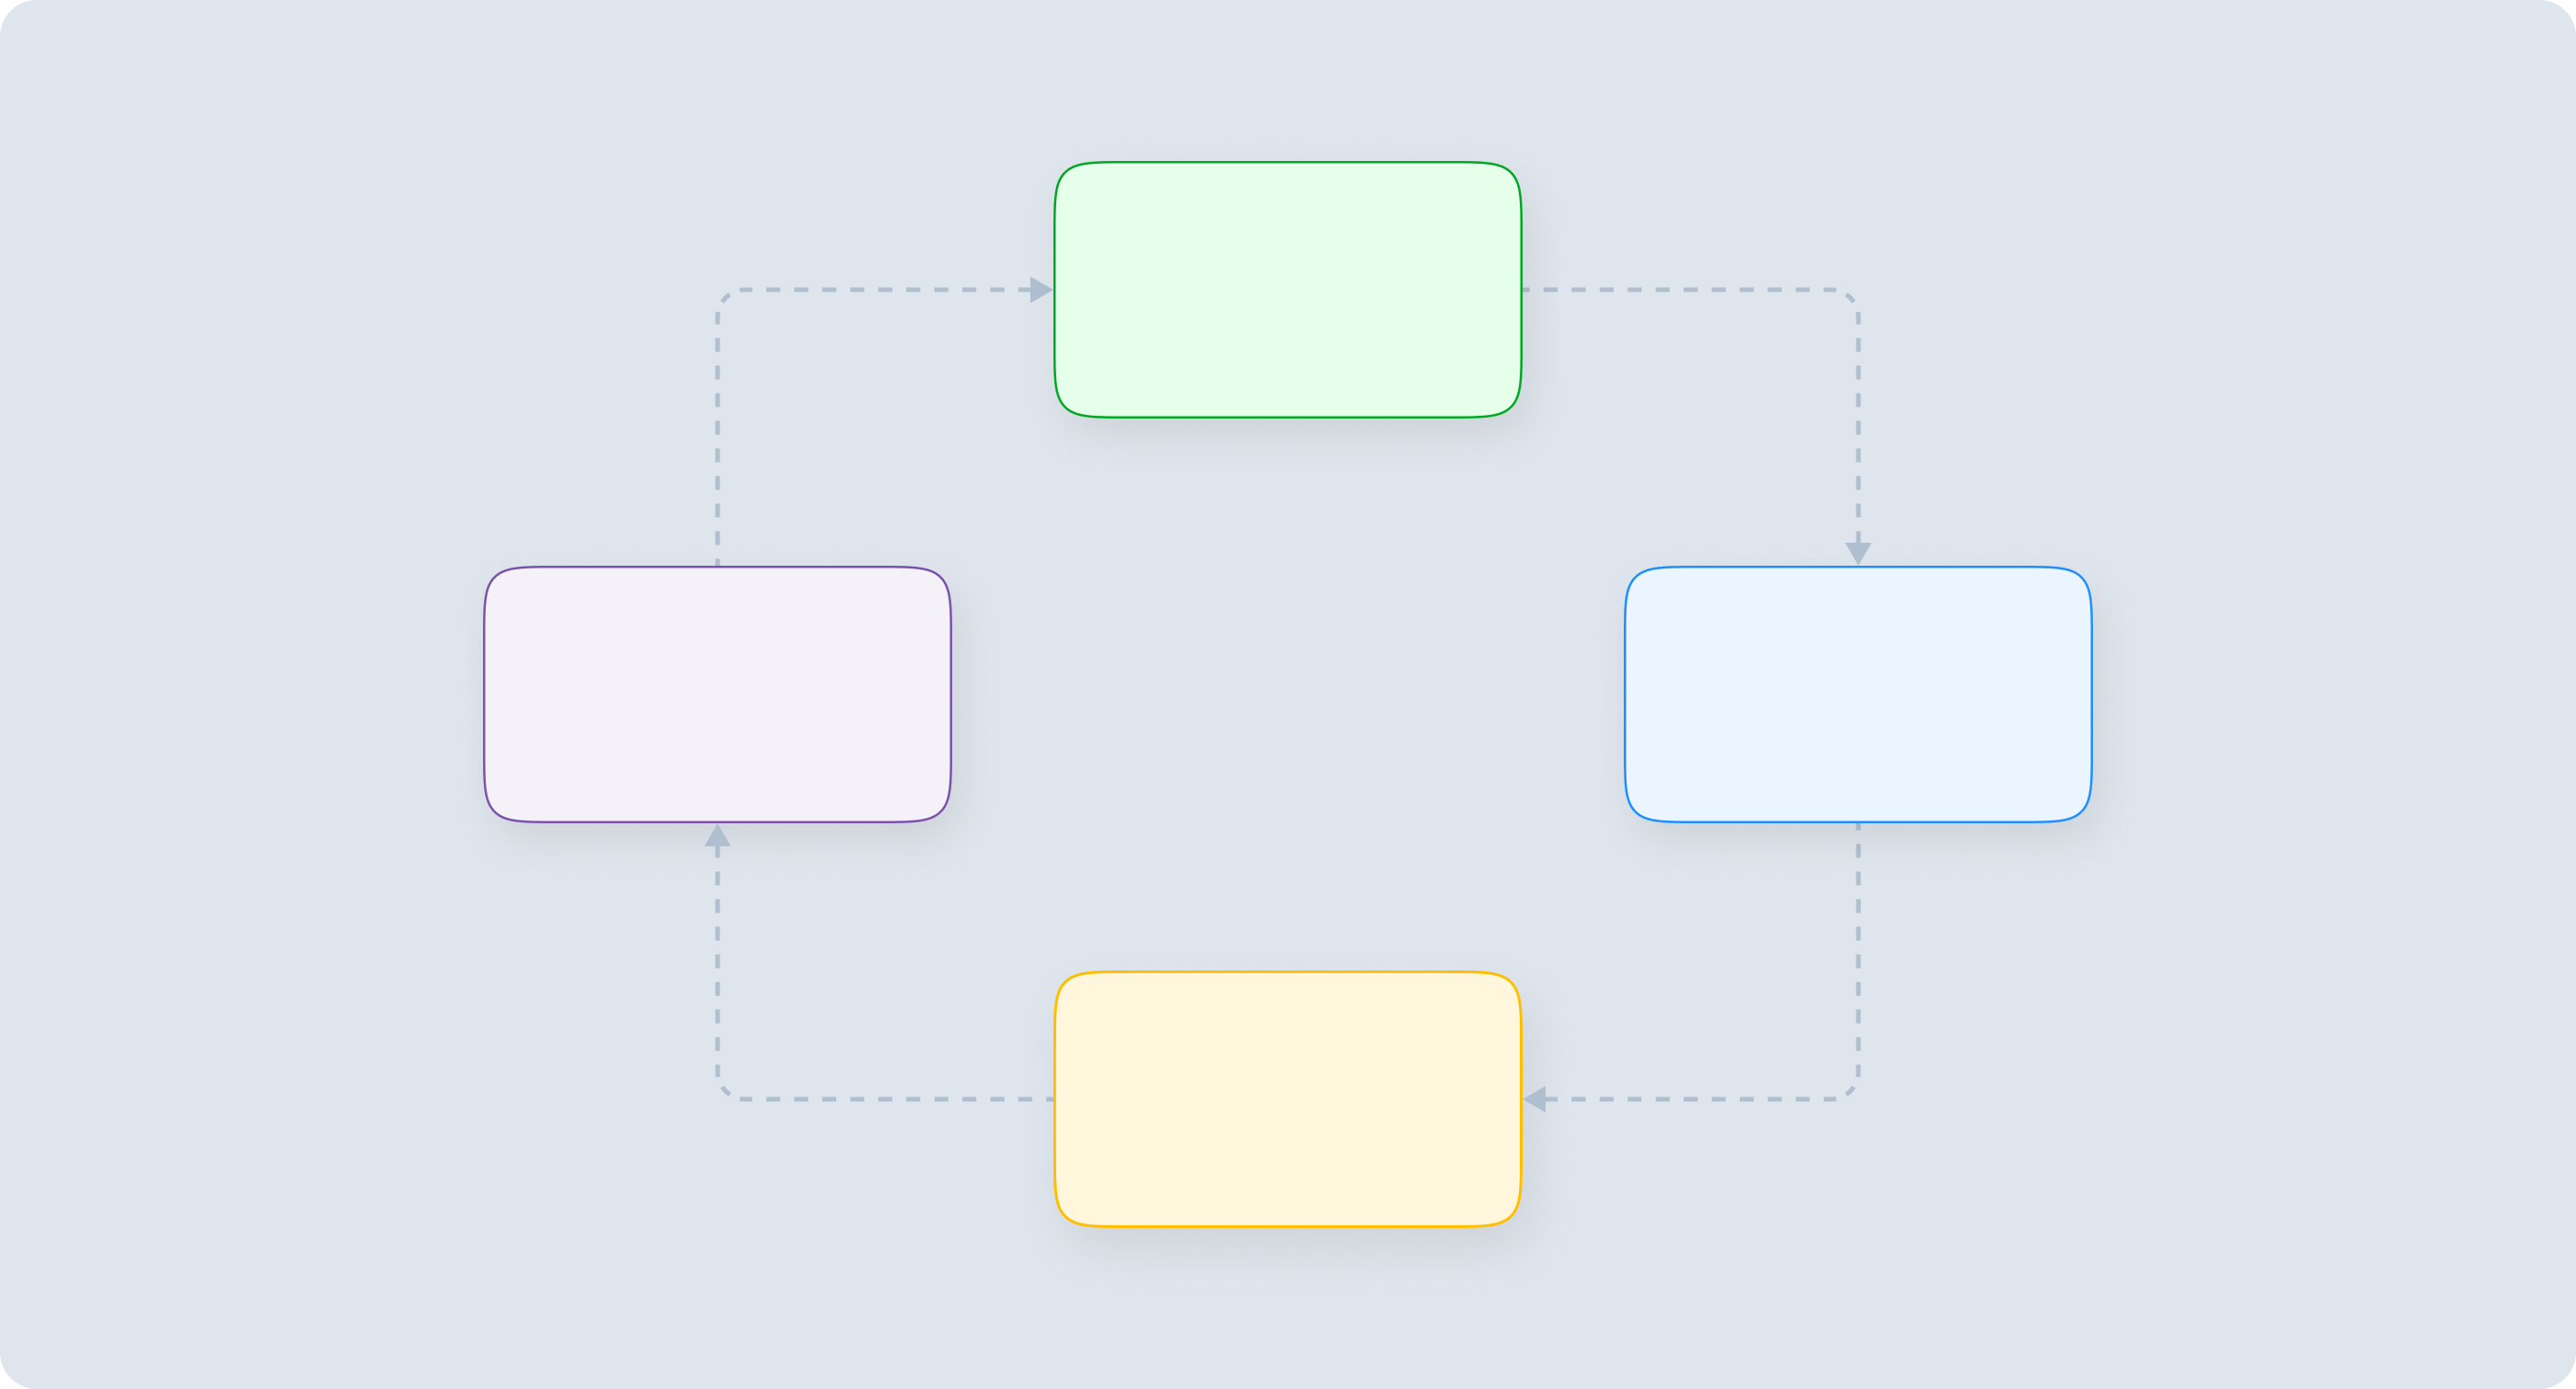
5. Data Flow Diagrams
Data flow diagrams depict the movement of data and information within a system. They consist of processes, data stores, data flows and external entities (the eventual data destination).
Data flow diagrams can show the physical flow of information and incorporate customers, workers, files, technology and software. You can also construct logical data flow documents to illustrate the theoretical flow of data through a planned system.
DFDs are particularly valuable when designing or improving information systems. These types of process maps provide a clear understanding of how data is input, processed and output, aiding in the identification of related issues and inefficiencies.
6. Gantt Charts
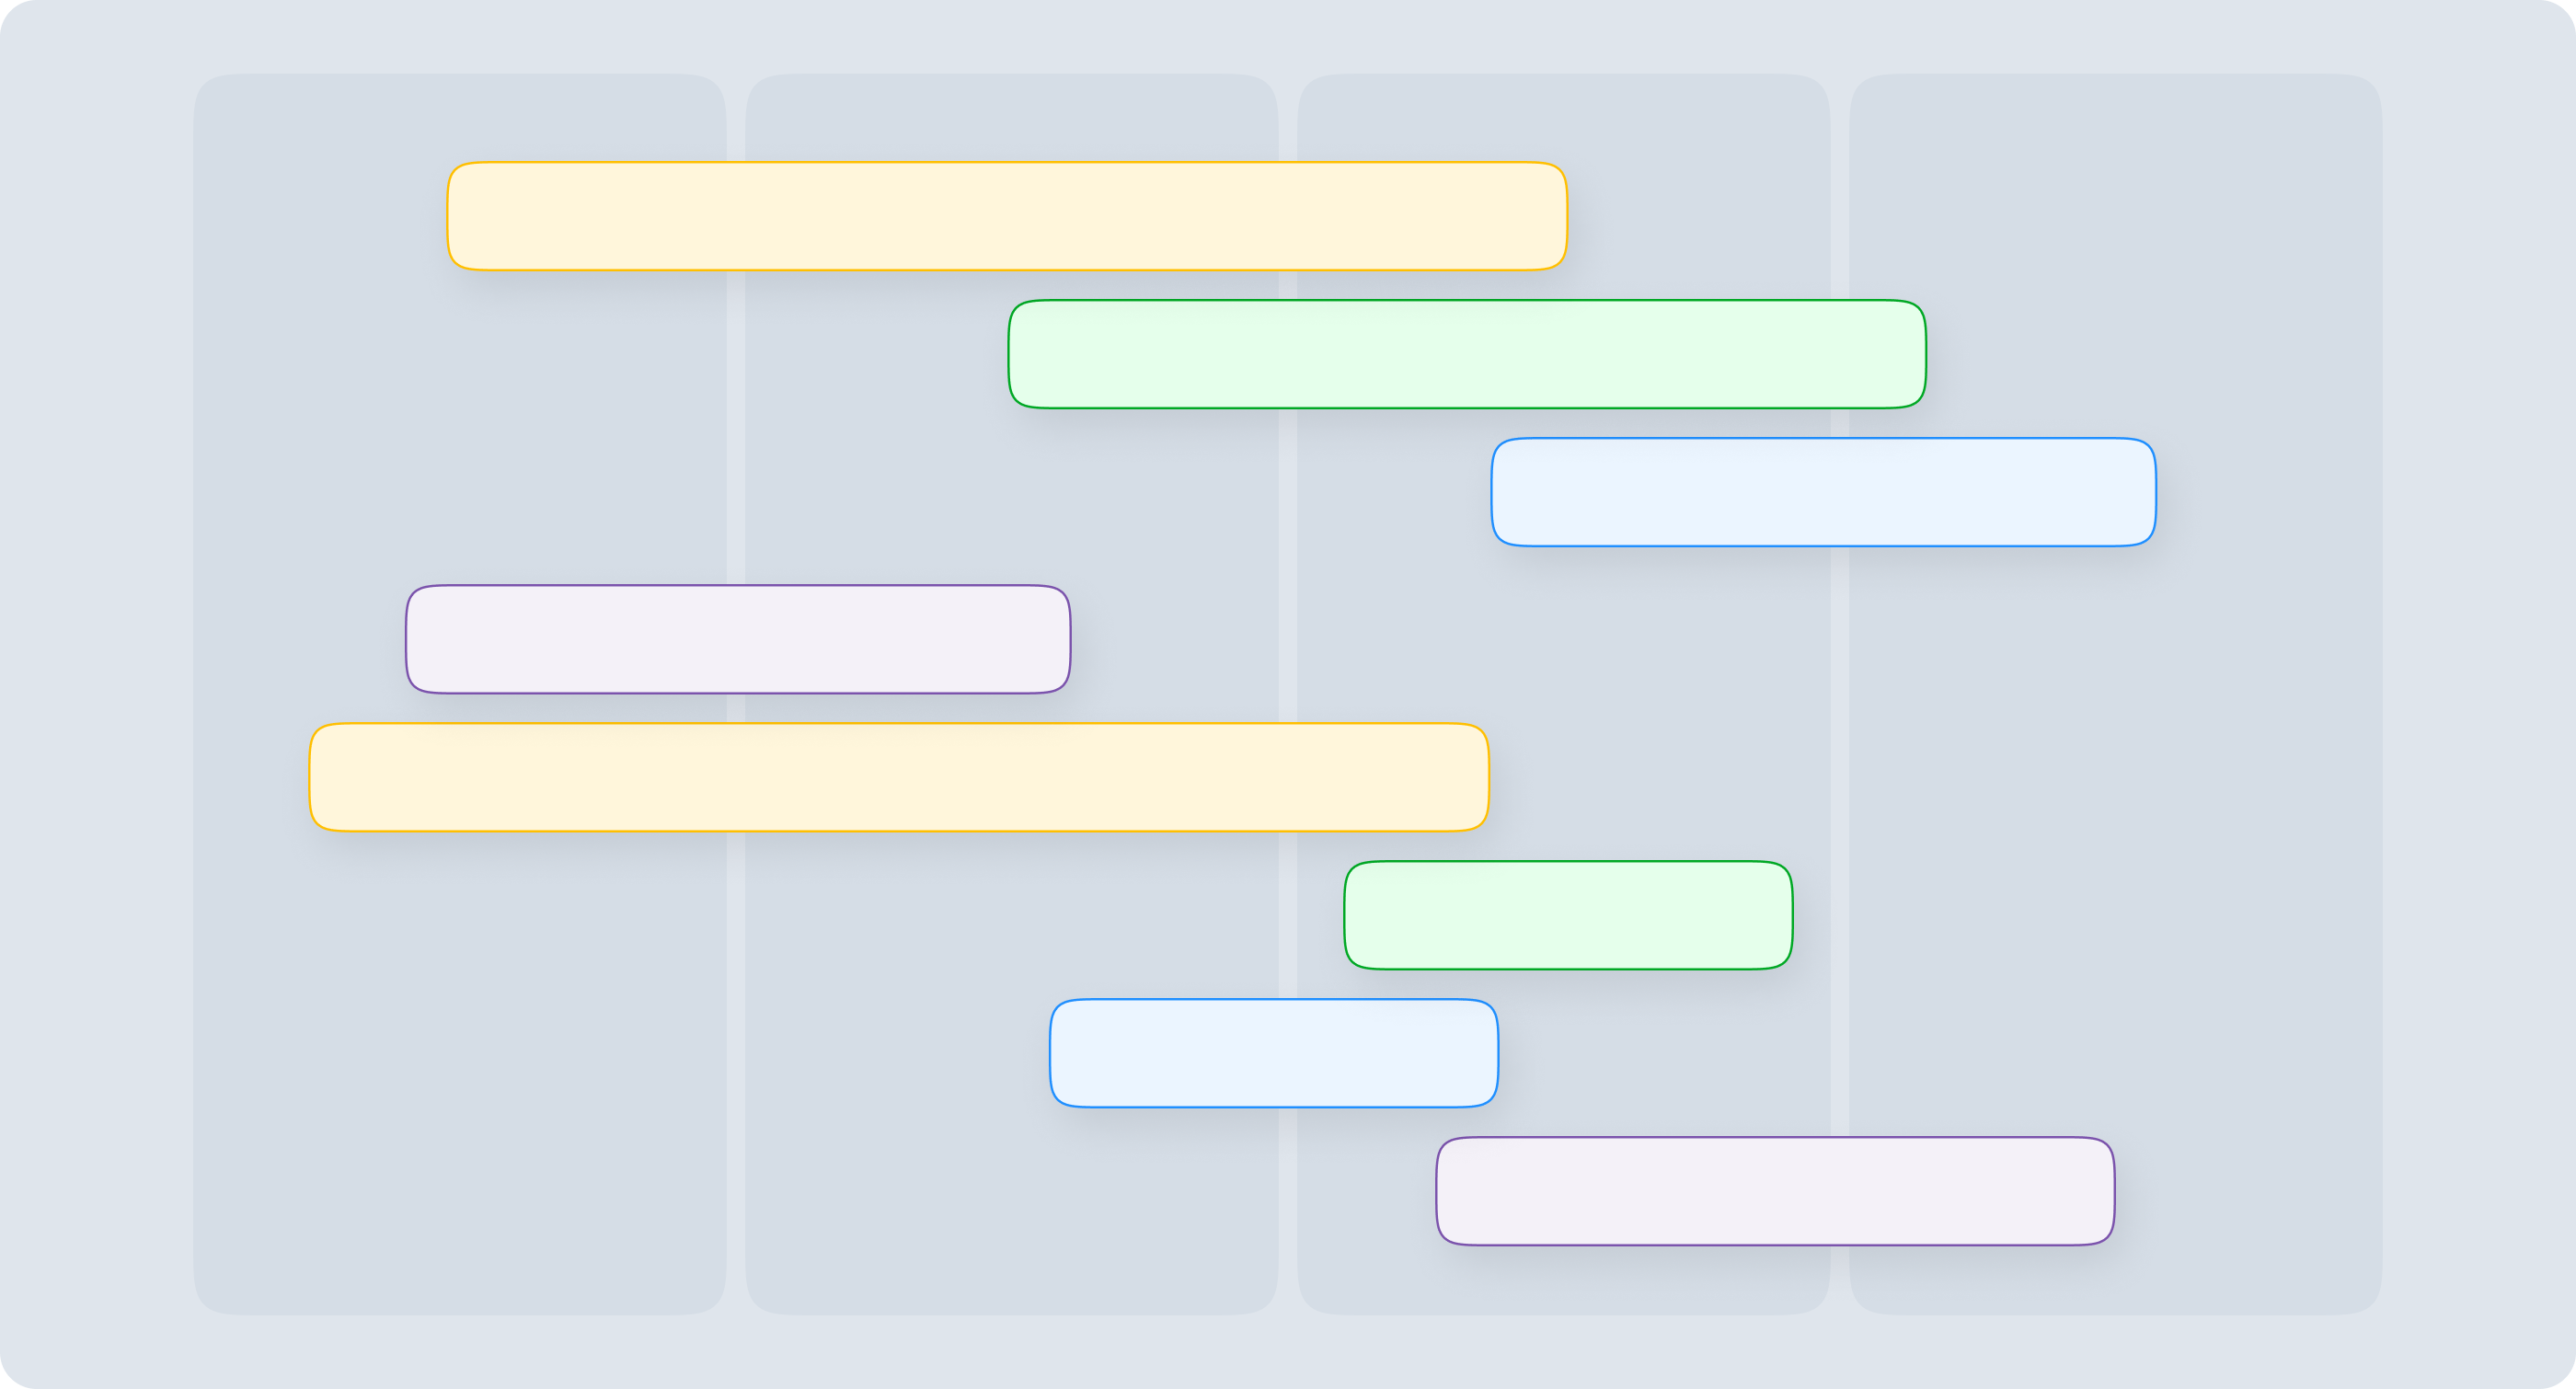
Gantt charts are widely used for project management, but you can also adapt them to depict business processes. These charts display a timeline of activities, tasks or events, each represented as a horizontal bar. The length of each bar corresponds to the duration of the activity. The position of the bars along the timeline shows when each task occurs.
Gantt charts help organizations manage their time effectively, plan and schedule activities, allocate resources and monitor progress. These types of process maps are instrumental in keeping projects on schedule. They can also help you identify redundancies quickly. In one study published in the journal Systematic Reviews, researchers used Gantt charts to identify duplicate records when gathering case data during the early days of the COVID-19 pandemic.
7. PERT Diagrams
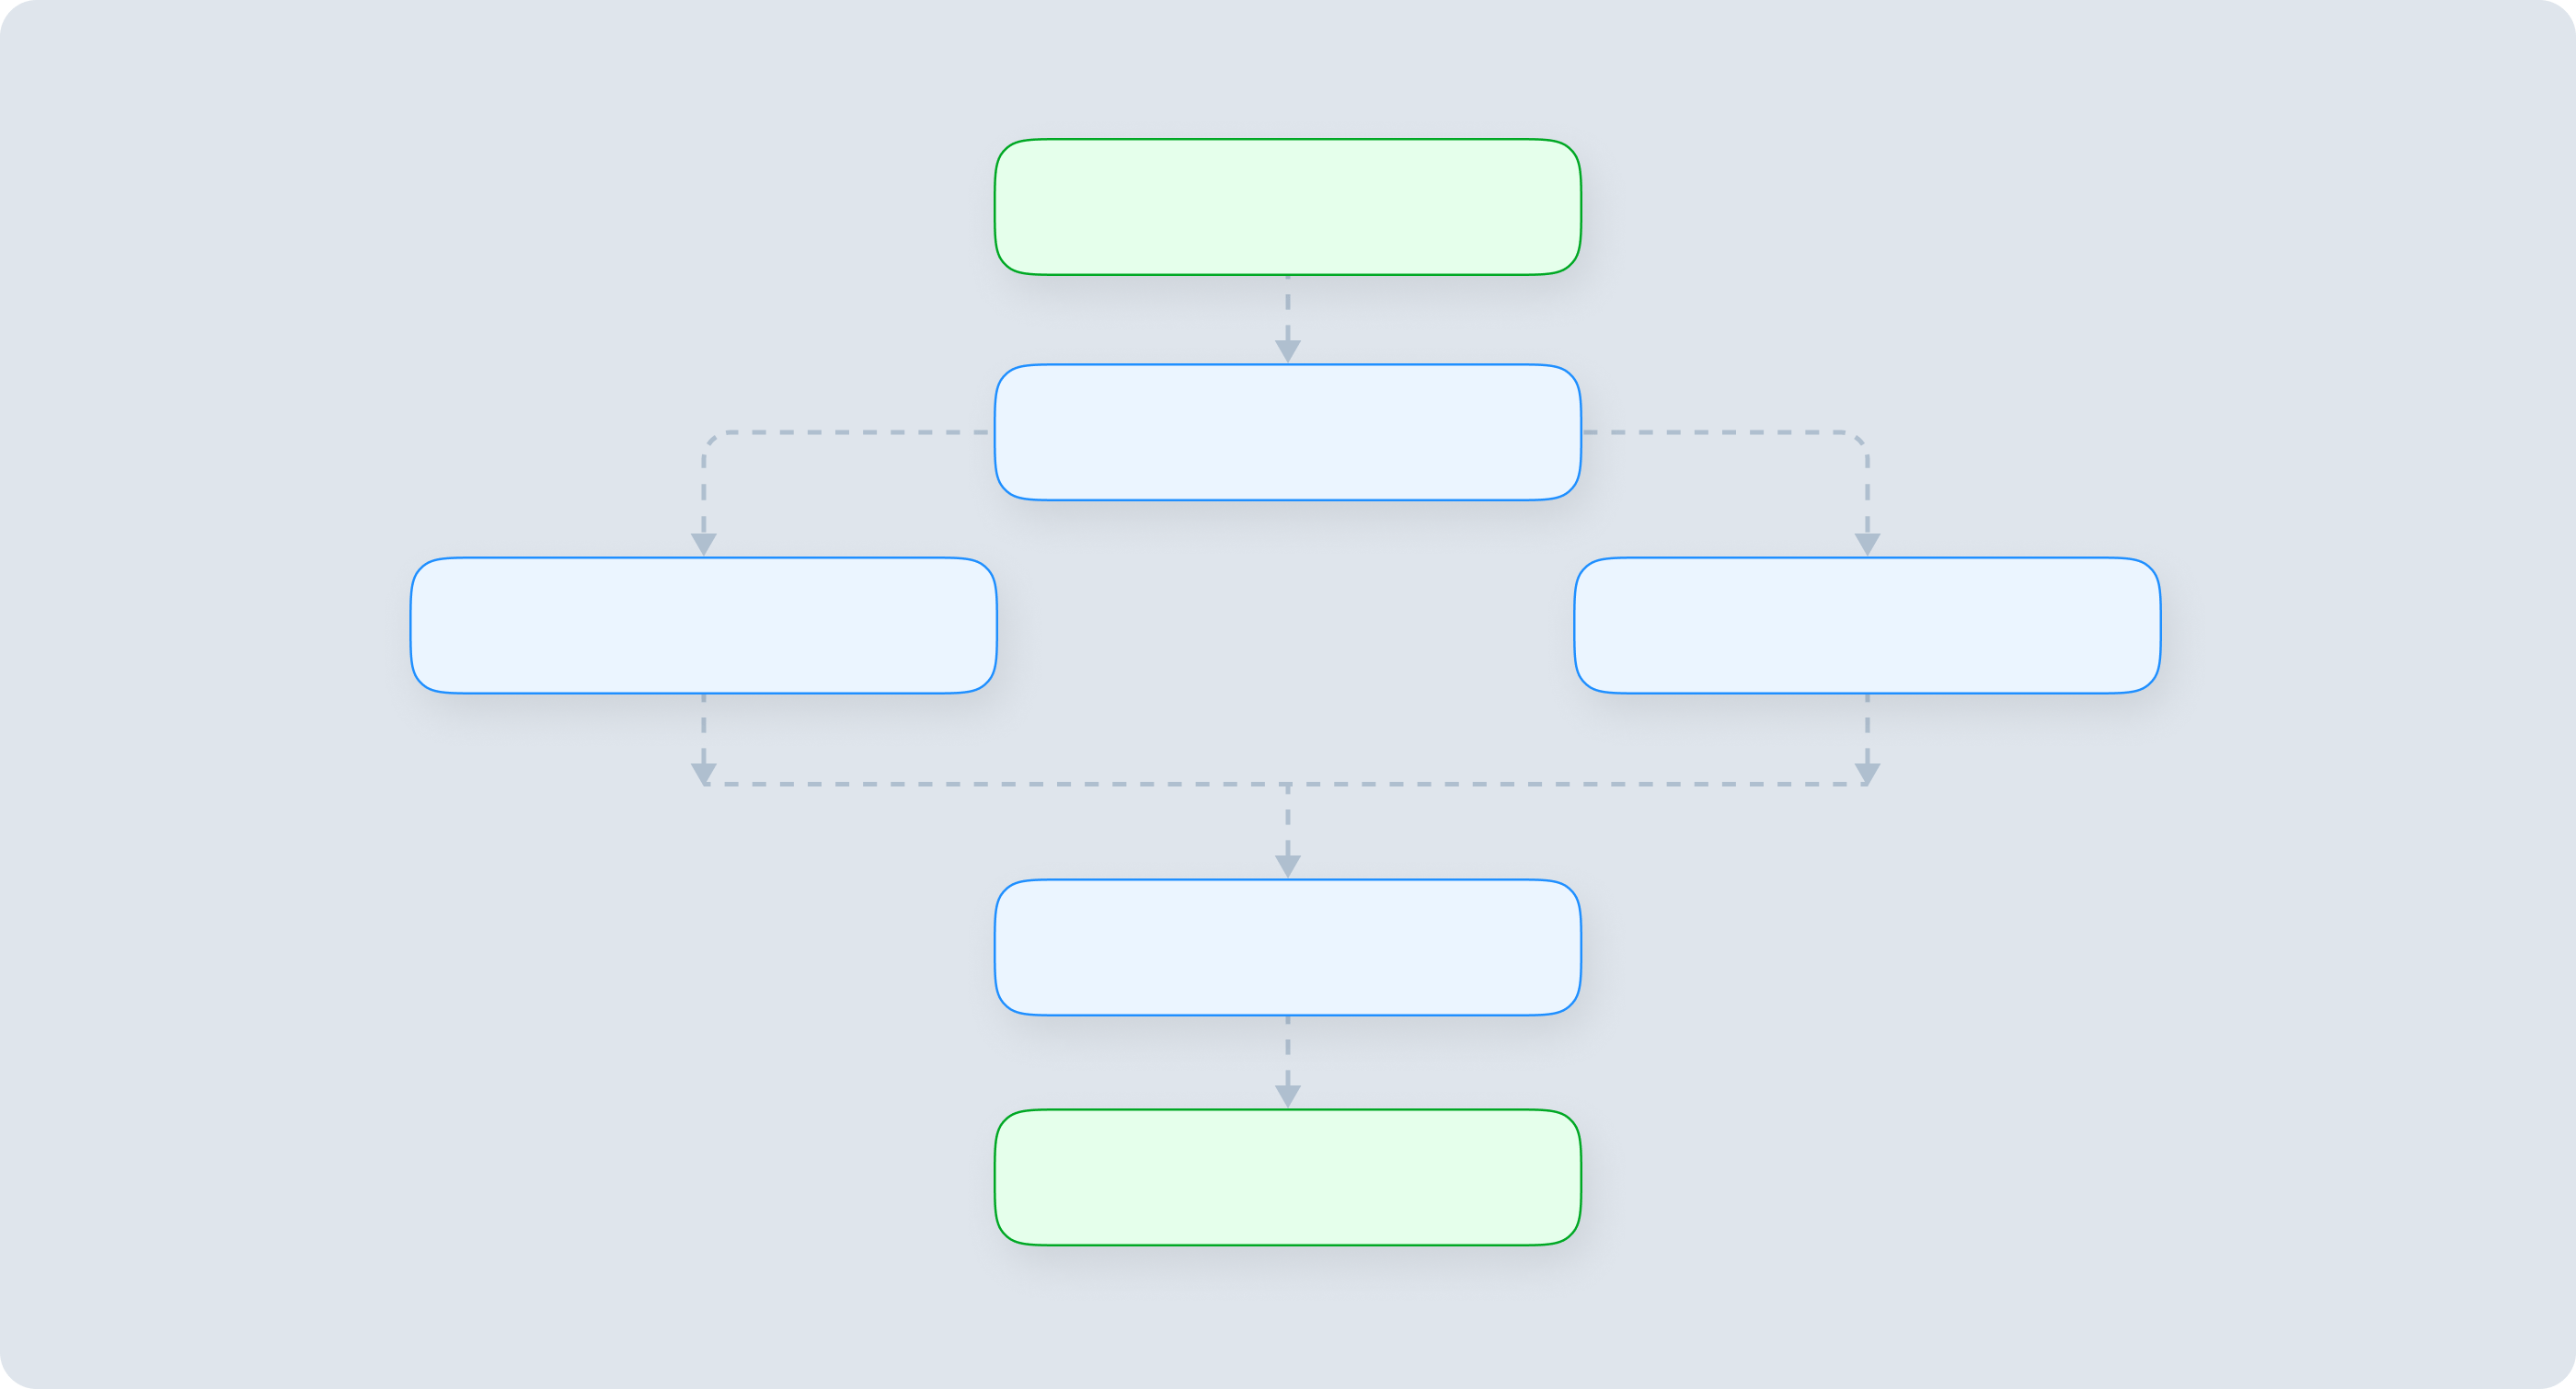
Program Evaluation and Review Technique diagrams manage complex processes with interdependent tasks. They show the project’s tasks, their sequence and the estimated time required for completion. These diagrams also include critical path analysis to identify the longest path and the tasks that must be completed on time to ensure the project stays on track.
PERT diagrams are valuable for project managers and teams to understand the project’s overall structure, identify potential delays and make informed decisions to keep the project on schedule. They can also help you find repetitive tasks that could benefit from automation, potentially increasing worker productivity by up to 50% according to MIT Sloan Management Review.
8. Check Sheets

Check sheets, also known as tally sheets, are a simple yet effective type of business process map used for data collection and analysis. They provide a structured format for recording and tallying specific observations or events. Check sheets are often used in quality control and Six Sigma methodologies.
These maps are helpful for identifying patterns and trends in data, making it easier to pinpoint areas for improvement. By consistently tracking data using check sheets, organizations can make data-driven decisions to enhance processes.
9. Fishbone Diagrams
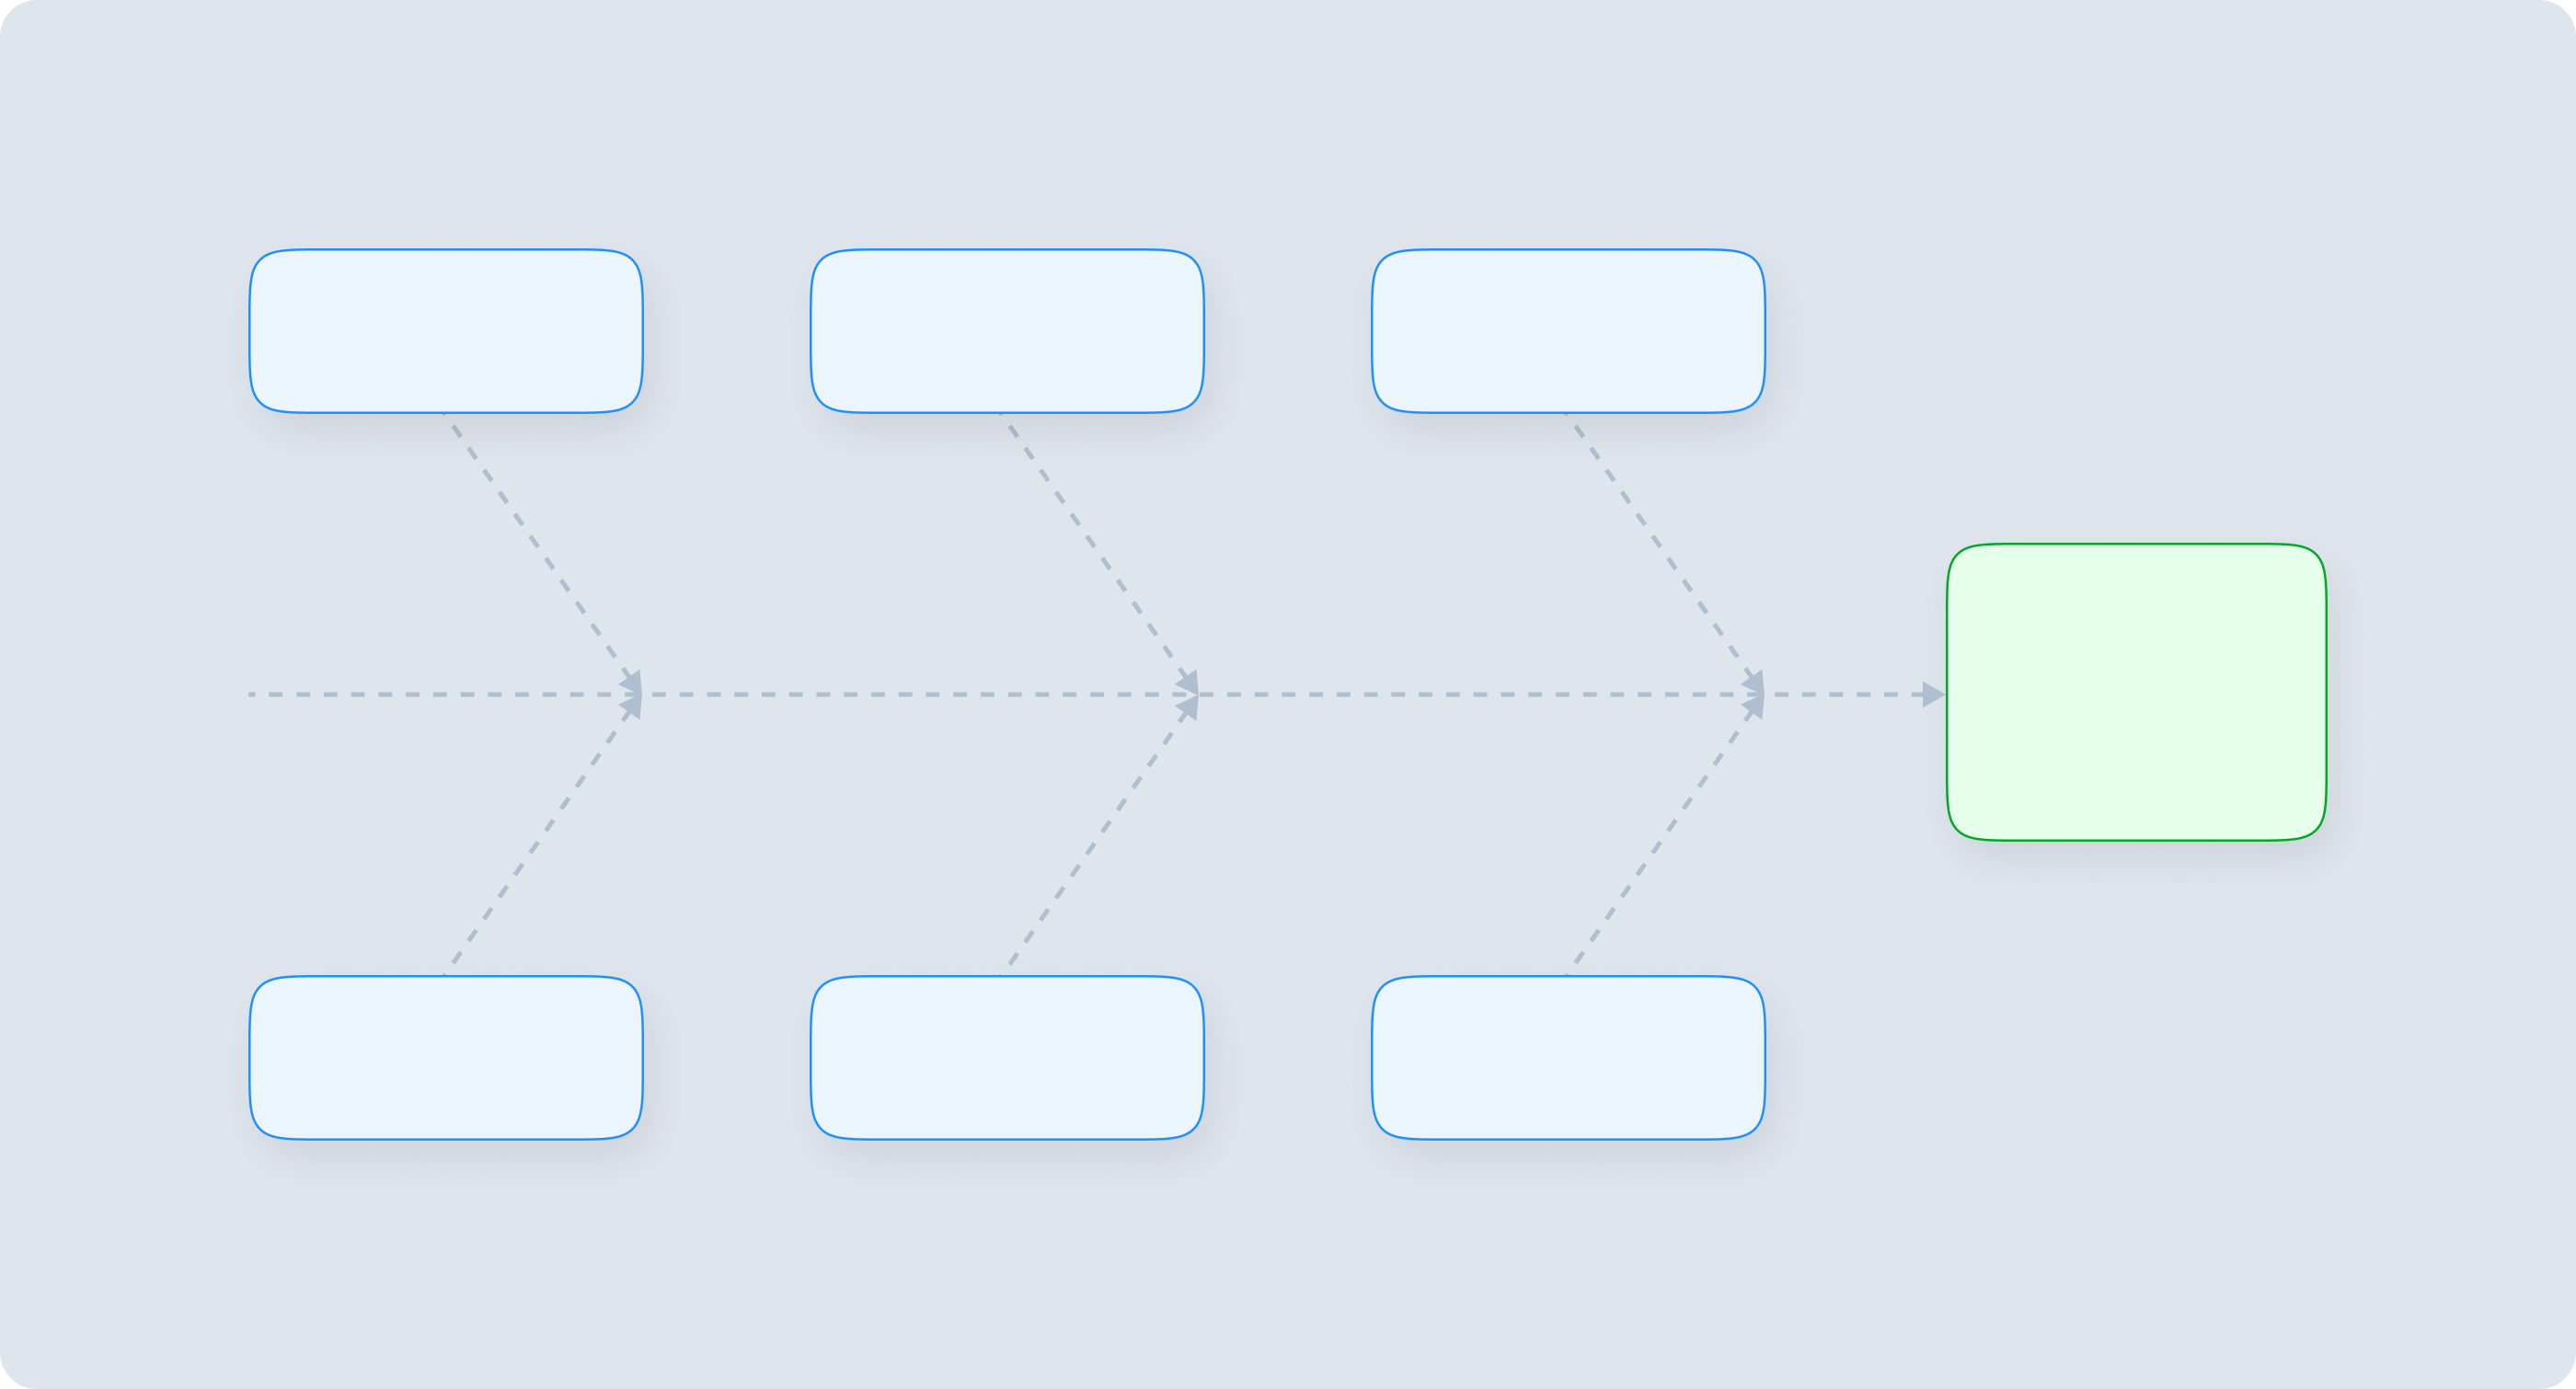
Also called Ishikawa or cause-and-effect diagrams, fishbone diagrams identify the root causes of a problem within a process. The diagram places the problem at the head of the “fish” and the potential causes branching out from the spine.
By analyzing the potential causes with these types of process maps, organizations can work towards addressing the root issues. You’ll ultimately improve the overall process and reduce the likelihood of recurring problems.
10. SIPOC Diagrams
Supplier-Input-Process-Output-Customer diagrams provide a high-level overview of these key process components. Many project managers also add an “R” to the acronym, which stands for Requirements.
SIPOC diagrams are instrumental in establishing boundaries and scope, especially when a process spans multiple departments or functions. They help teams understand the process context and identify key stakeholders.
For these reasons, you may want to use a SIPOC or SIPOC-R diagram to document high-level process steps as the foundation of a thorough mapping initiative. However, this isn’t the best process map if you want to display interdependencies or highlight task ownership.
11. Mind Maps
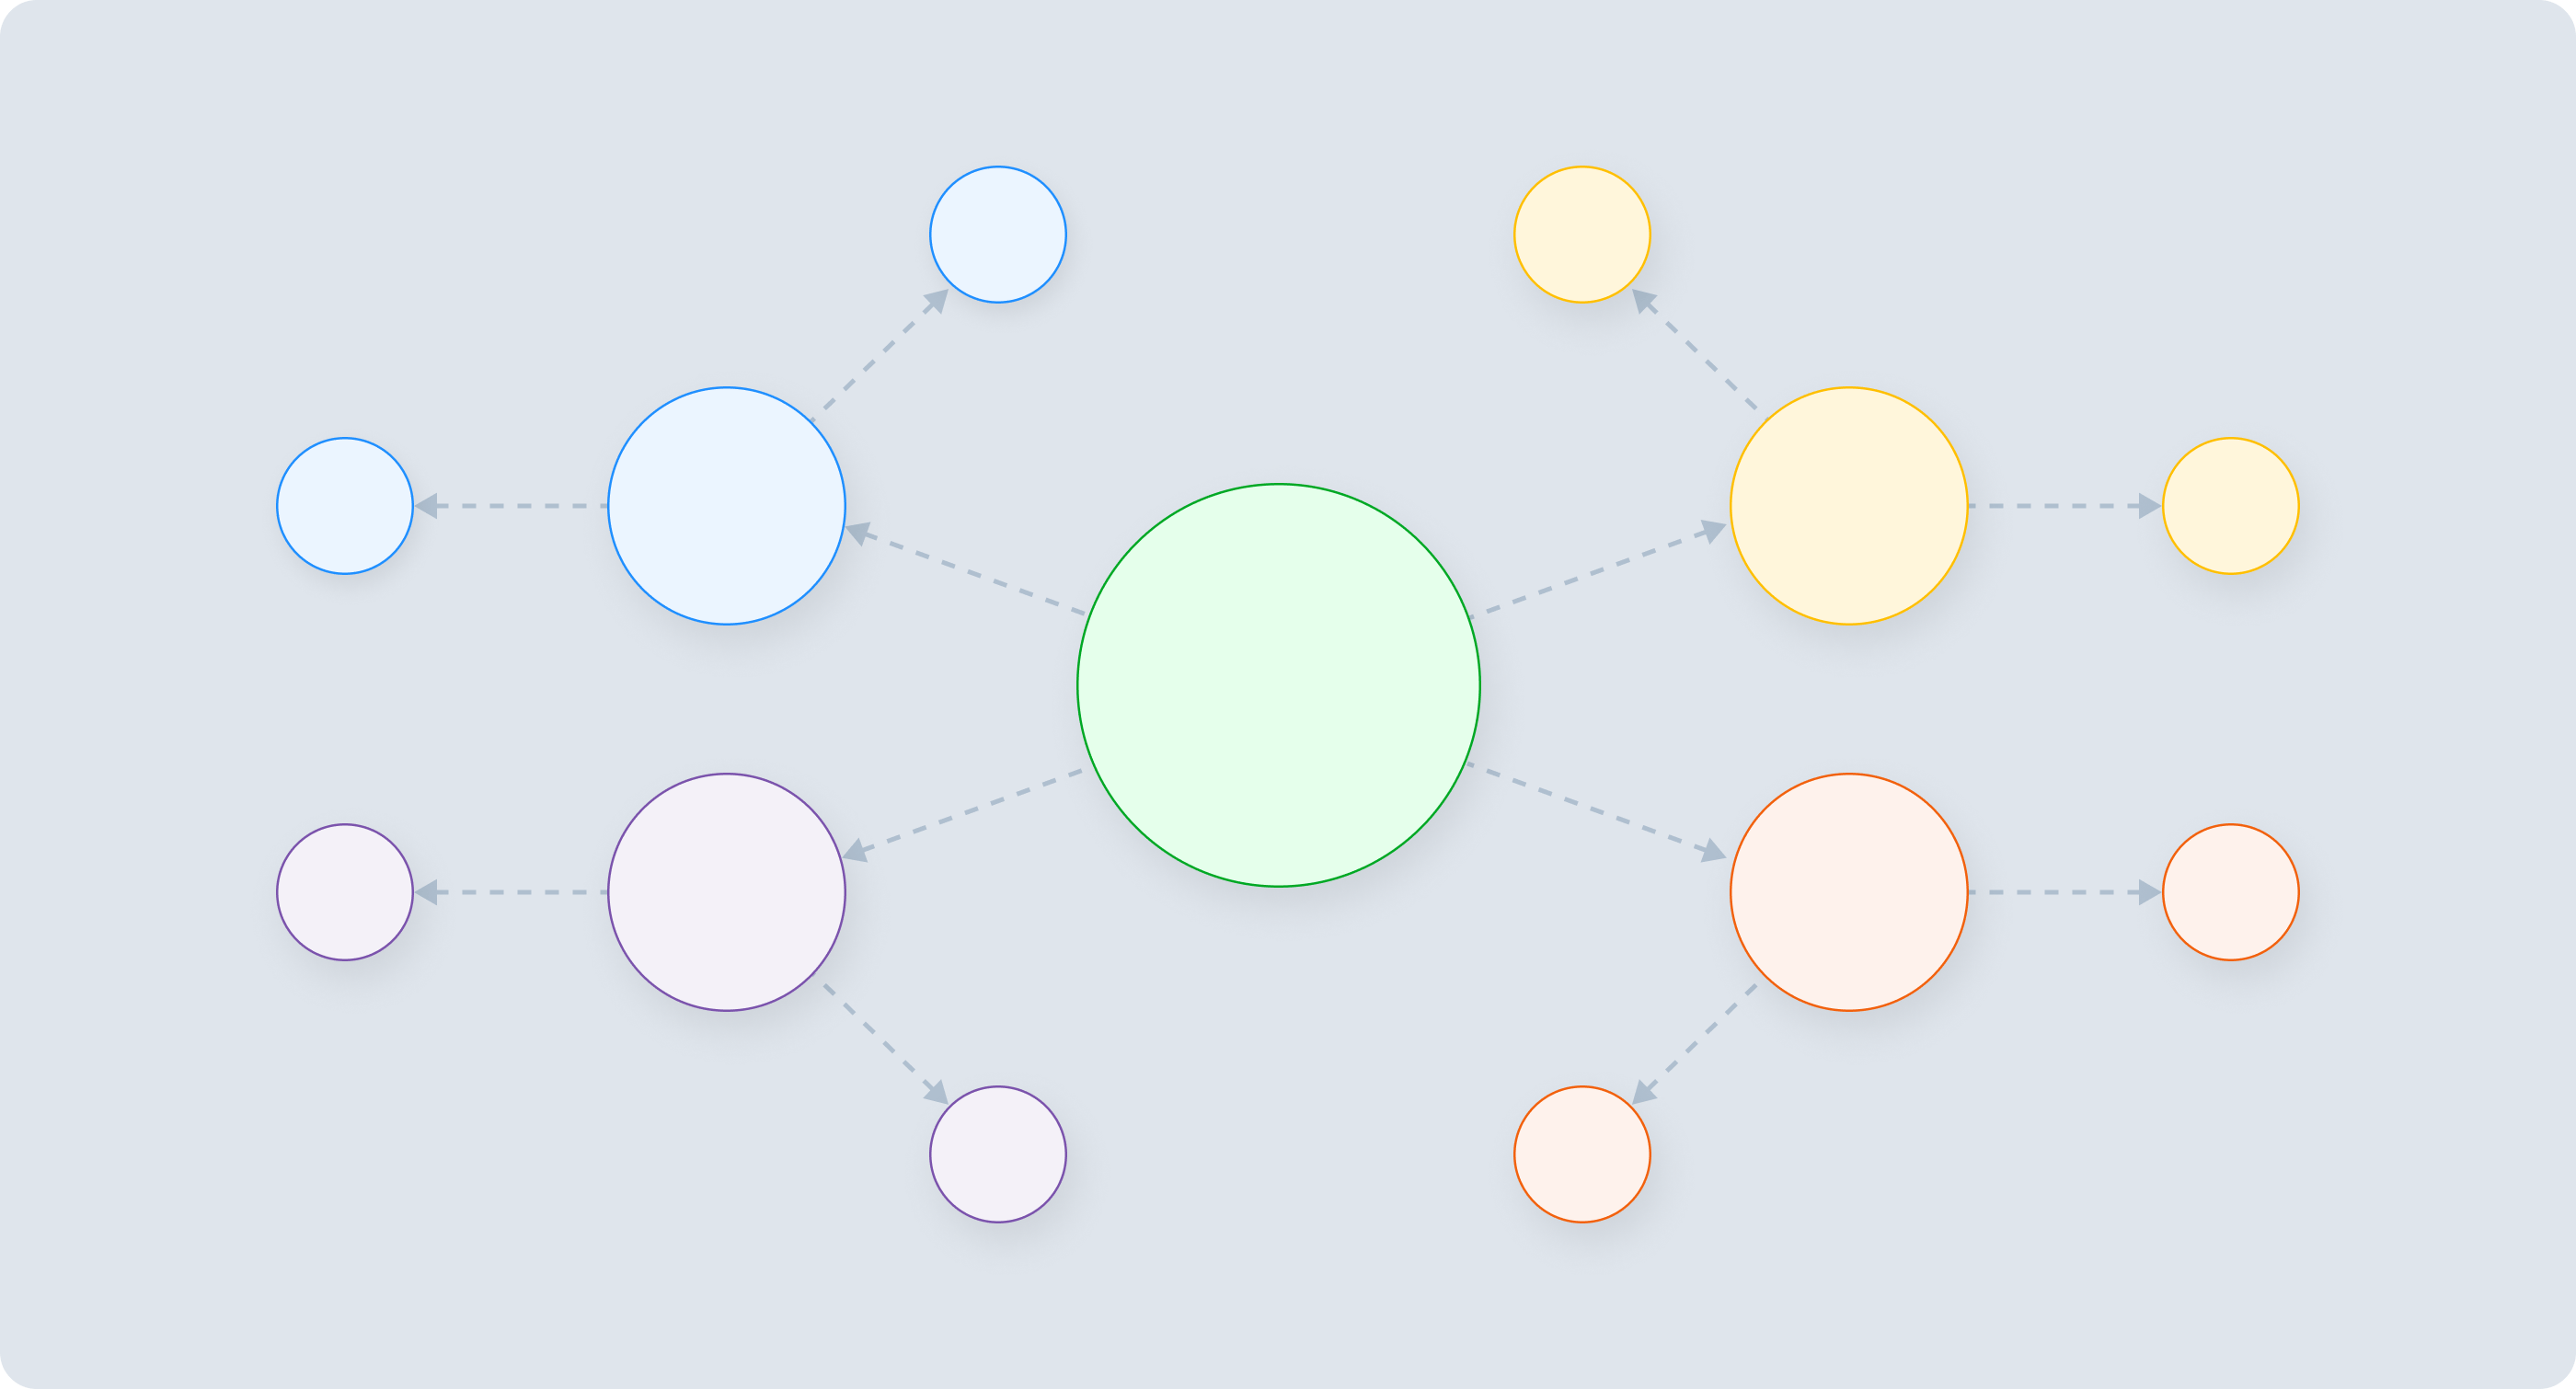
These versatile visual tools can apply to various aspects of business, including process mapping. They start with a central idea or topic and branch out into subtopics and related concepts. Mind maps encourage creative thinking, brainstorming and problem-solving.
While not as structured as some other process maps, mind maps can be invaluable for exploring ideas, capturing insights and generating innovative solutions within a business context. You can also use your mind map as a starting point to organize information when developing a new service line or workflow.
12. High-Level Process Maps
To document the most basic steps of a workflow, you can use a high-level process map. Also called a value chain or top-down map, this diagram provides the basics without delving into details of the tasks and subtasks. Usually you’ll use these types of process maps to illustrate processes for key stakeholders and external partners who need to understand the thousand-foot view.
Choosing Software to Create Different Types of Process Maps
Business process maps are indispensable tools for understanding, analyzing, and improving the way organizations operate. Each type of map serves a specific purpose, from simplifying complex processes with flowcharts to identifying root causes with fishbone diagrams.
The answer to how to create a process map is by using the right type of tools which will help your business enhance its efficiency, productivity, customer satisfaction and quality.
Fluix workflow automation software has an easy-to-use drag-and-drop interface where you can build diagram maps, with no coding knowledge required.
This will allow you to automate document workflows, streamlining the flow of documents through different stages. Each stage in the workflow can be considered a step in your process, and you can use Fluix to define the sequence of these steps.
Want to Start Automating Your Workflows and Processes?
Give us 15 minutes to show you how to do it easily in Fluix