


Dashboard Filters provide a powerful way to refine dashboard data, helping quickly focus on the information that matters most. By filtering results based on process attributes or form data, you can uncover meaningful insights and create more detailed reports and charts.
By selecting the Add Filter menu, you can narrow down dashboard results by applying filters based on process information and form data in both View by Process and View by Form.
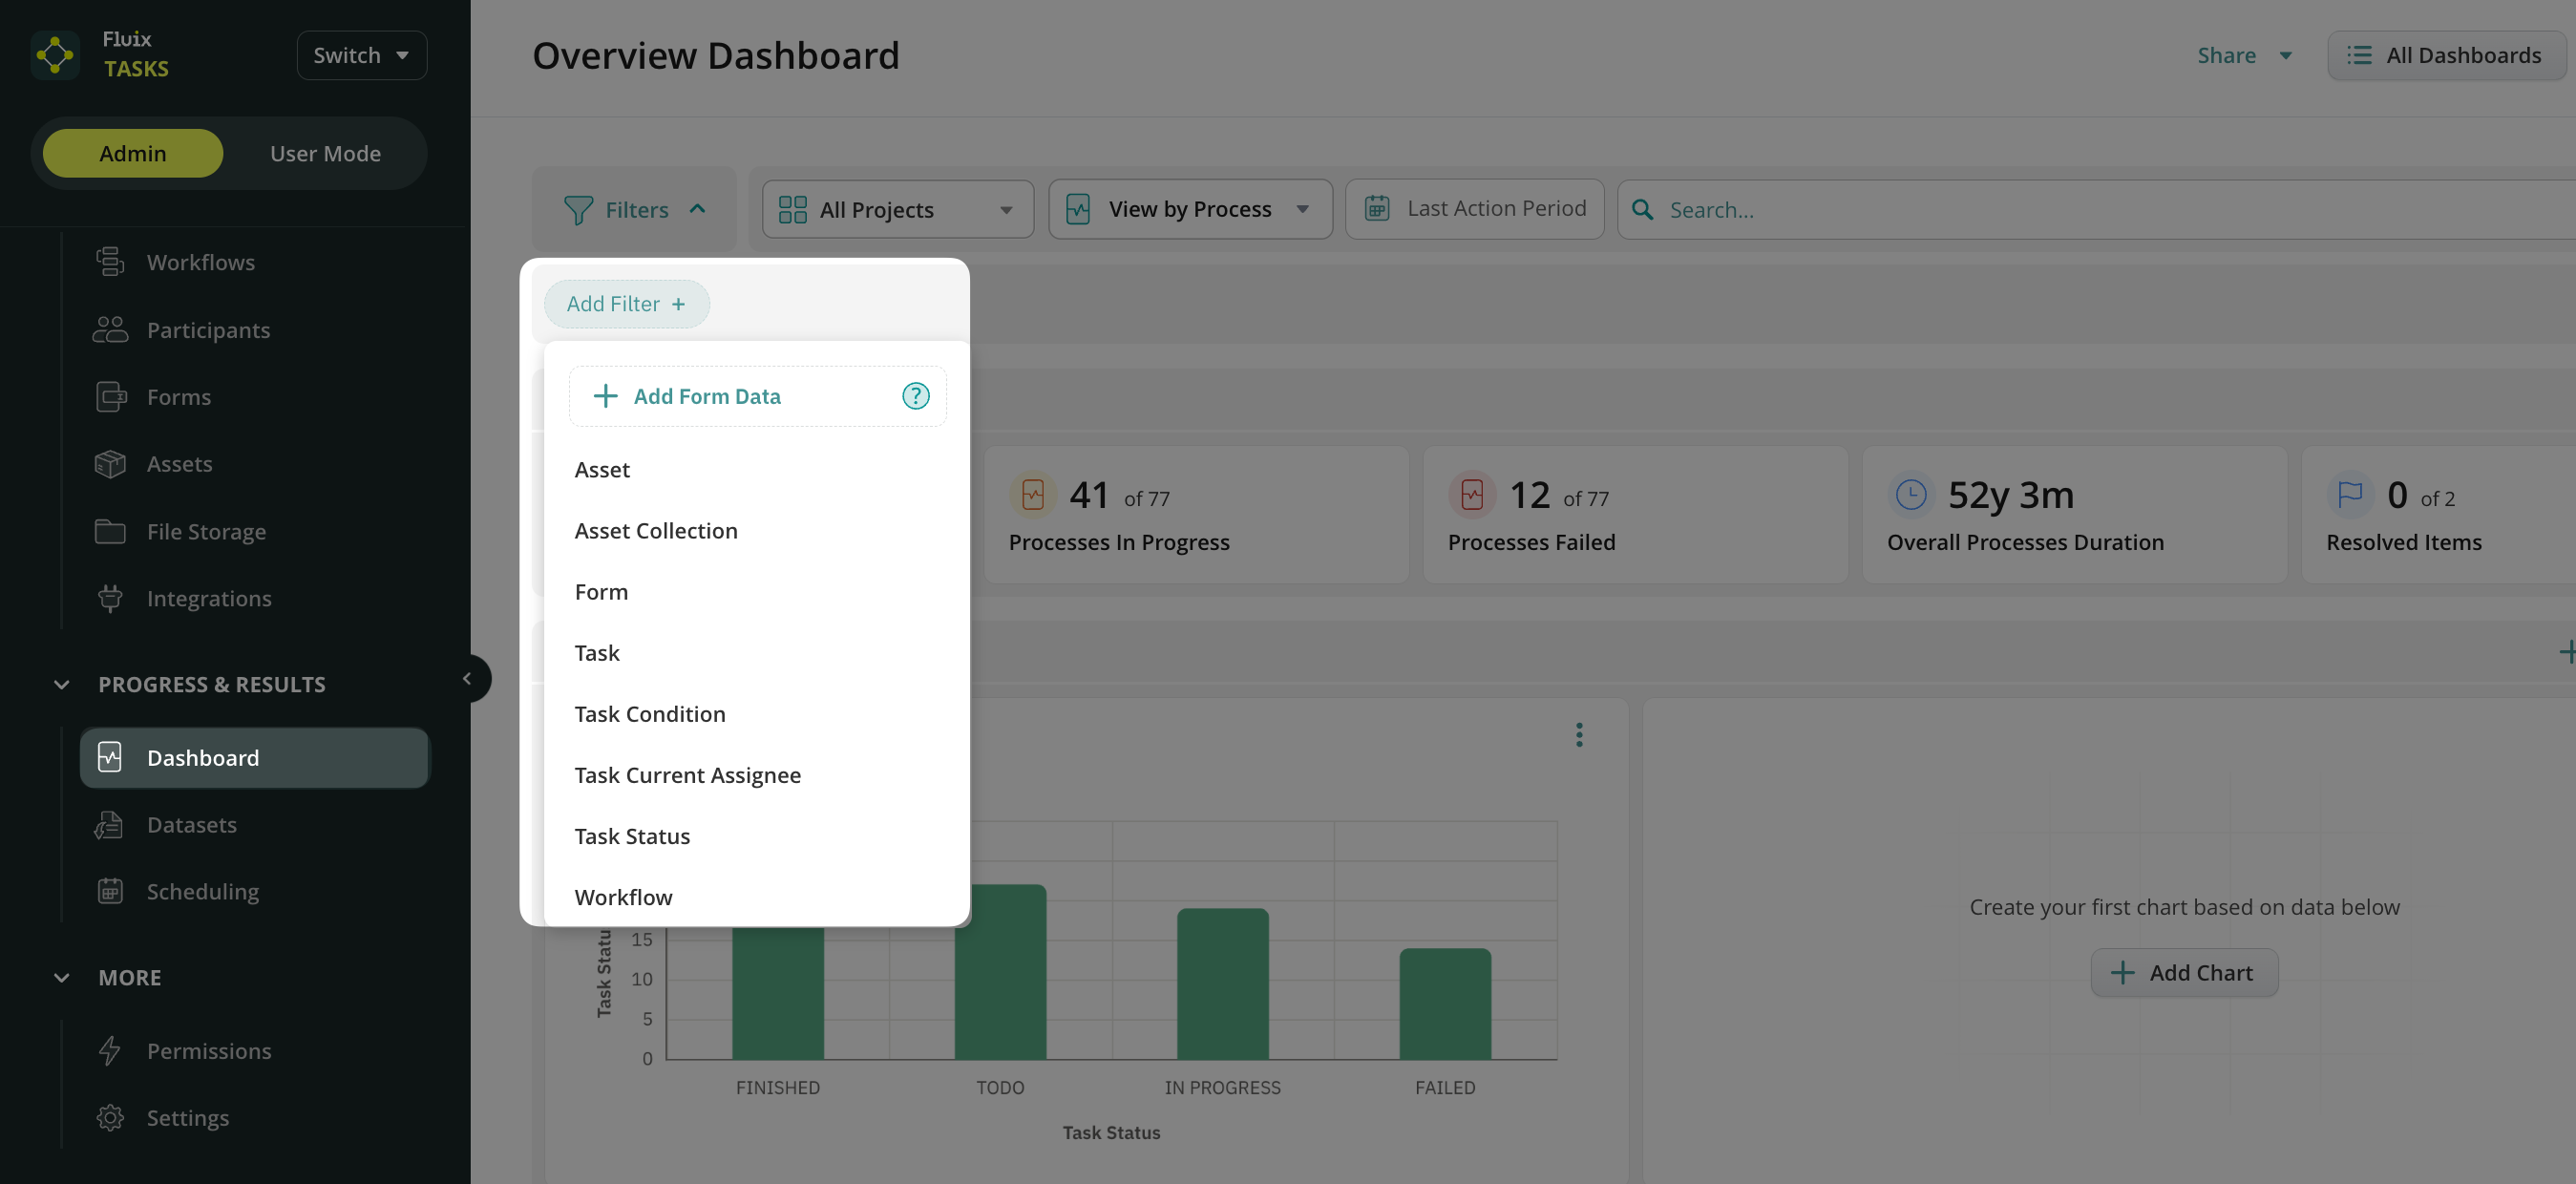
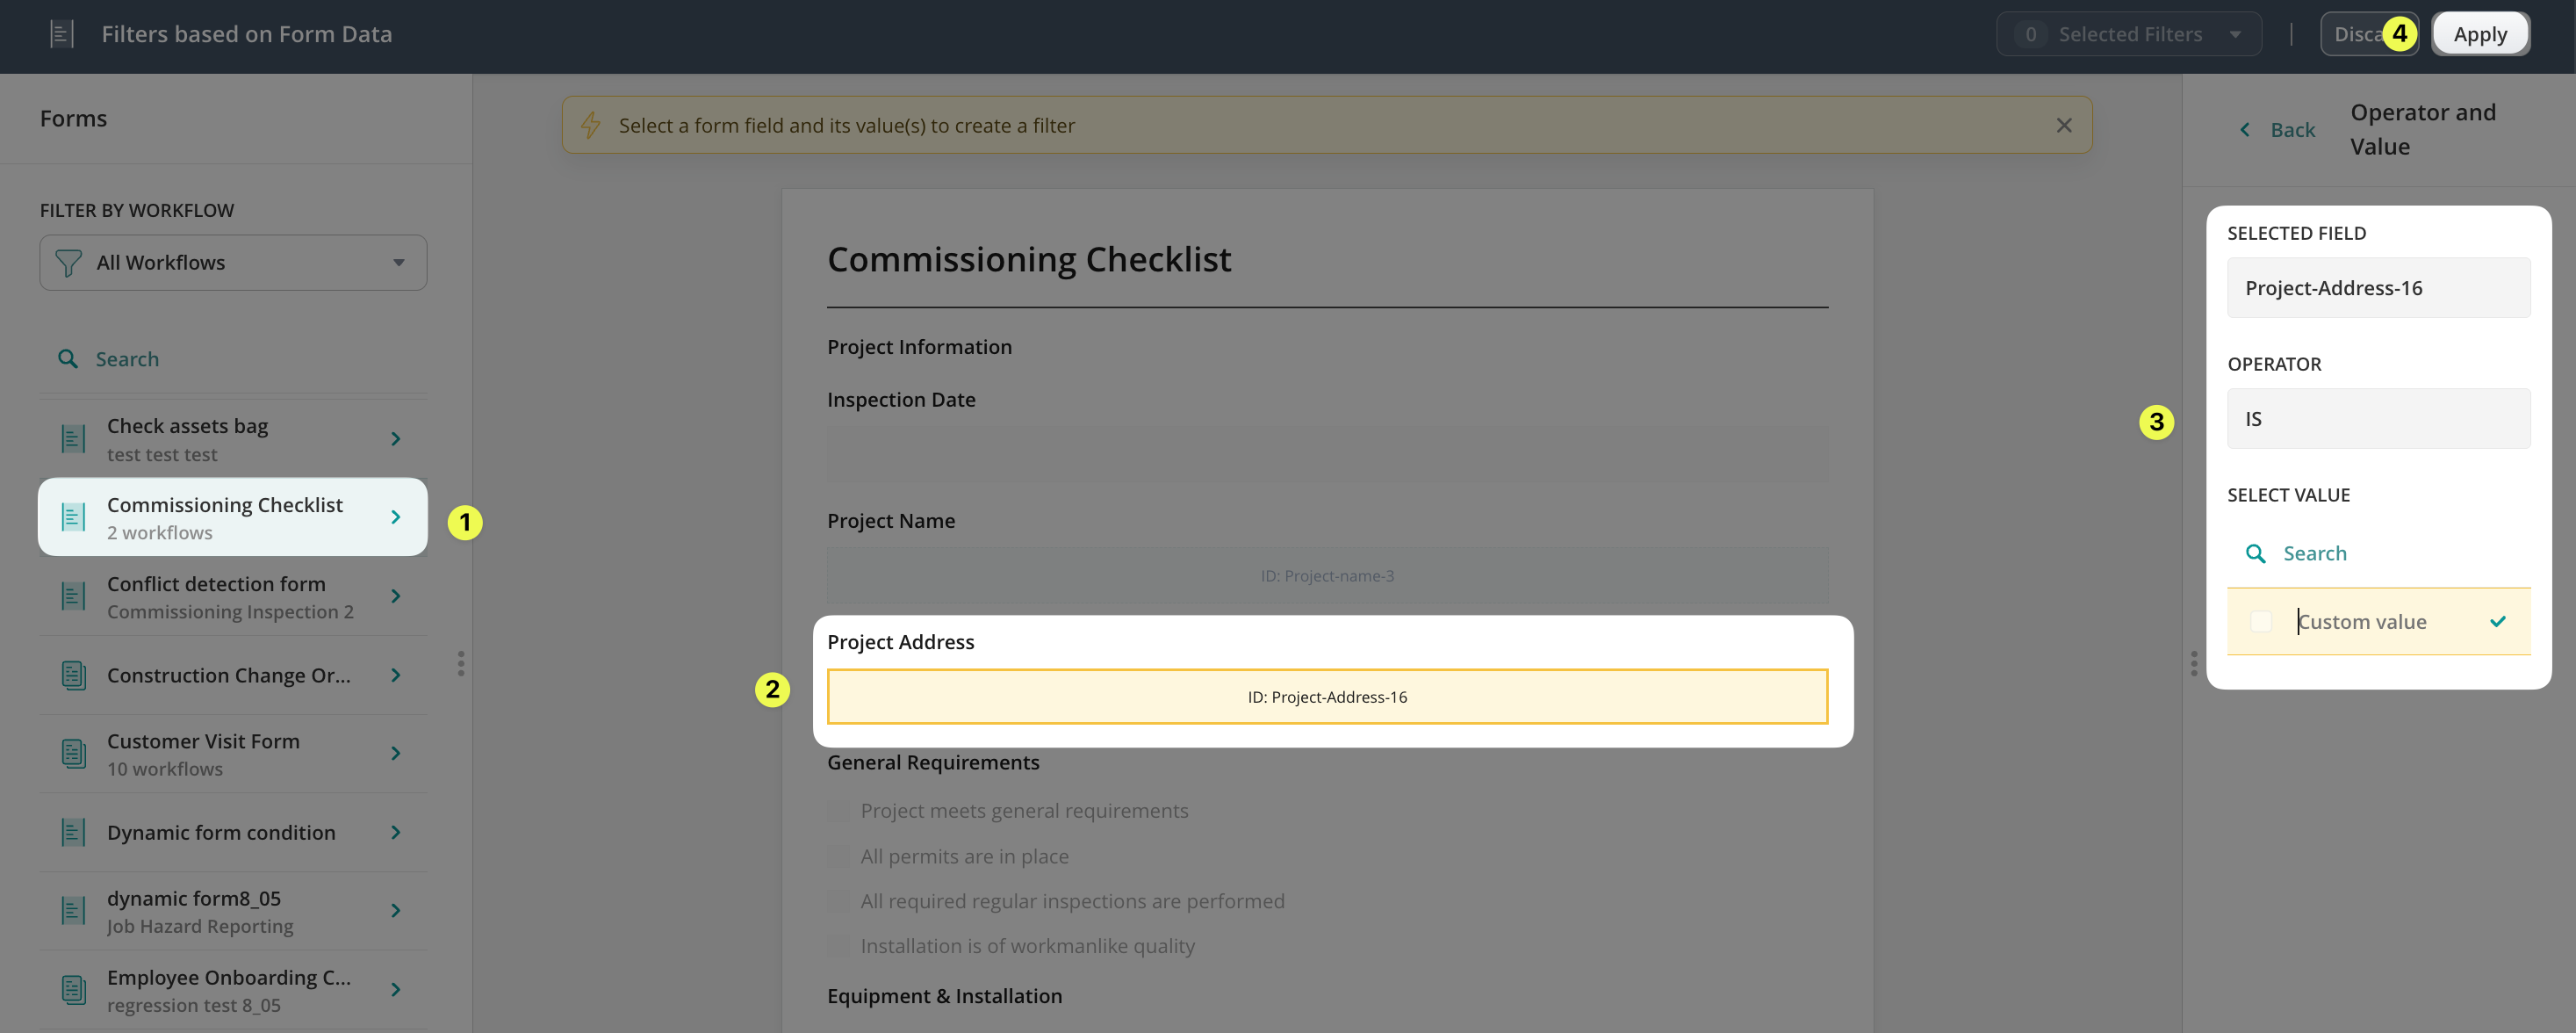
- Add Form Data option provides filtering capabilities by allowing you to filter dashboard data based on values captured in forms. You can select a form field and add a value to quickly locate records that match particular criteria, such as a project name, document number, location, or any other form field value.
- Asset limits dashboard results to those associated with a specific asset. Select an asset to view only the processes/forms linked to that asset.
- Asset Collection filters by a specific database uploaded to the Fluix Admin Portal.
- Flagged Items highlight processes containing flagged records, helping you quickly identify items that require attention or follow-up.
- Form allows you to focus on data originating from one or more selected forms. Choose a form from the available list to view only the processes related to that form.
- Report Added lets you check which processes or forms (depending on your View By selection) have a generated Issue Summary.
- Task filters the active processes based on the task name entered in the field.
- Task Condition helps identify tasks that are Overdue or Undelivered, so that you can contact the user, group, or guest and follow up on the task’s progress.
- Task Current Assignee shows activities assigned to a selected user or group.
- Task Status filters the processes by To Do, In Progress, Finished, Failed, Deleted, and Suspended statuses.
- Workflow displays information associated with the selected workflow.
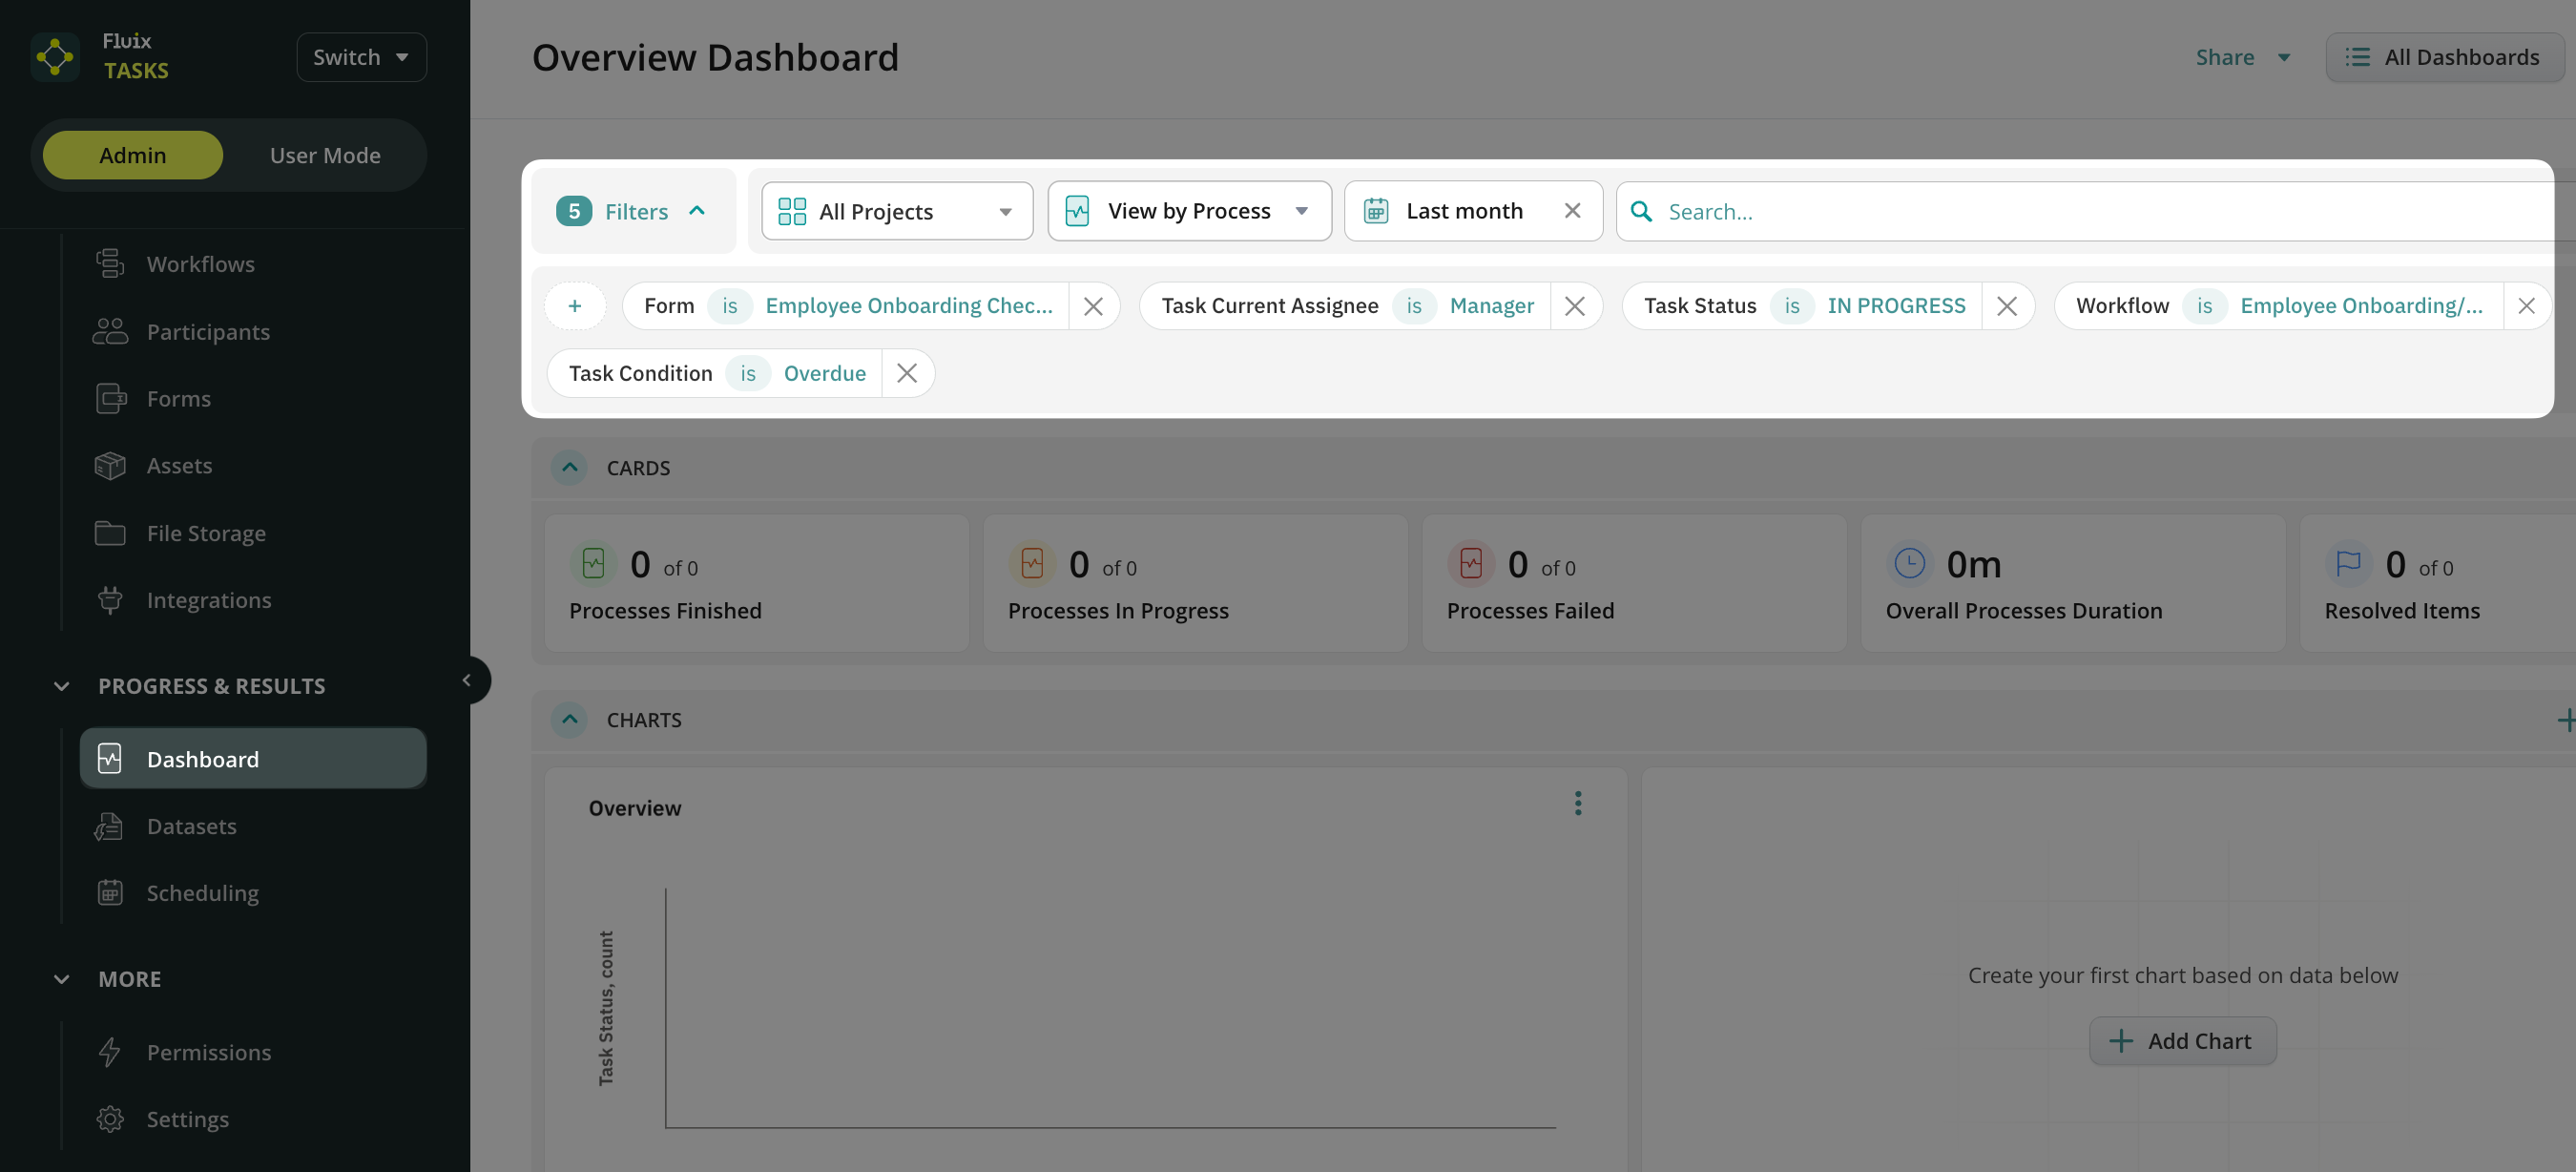
Multiple filters can be applied simultaneously, making it easy to create highly targeted dashboard views. For example, you can combine form, workflow, task status, task assignee, and form field values to display only the information relevant to your analysis.
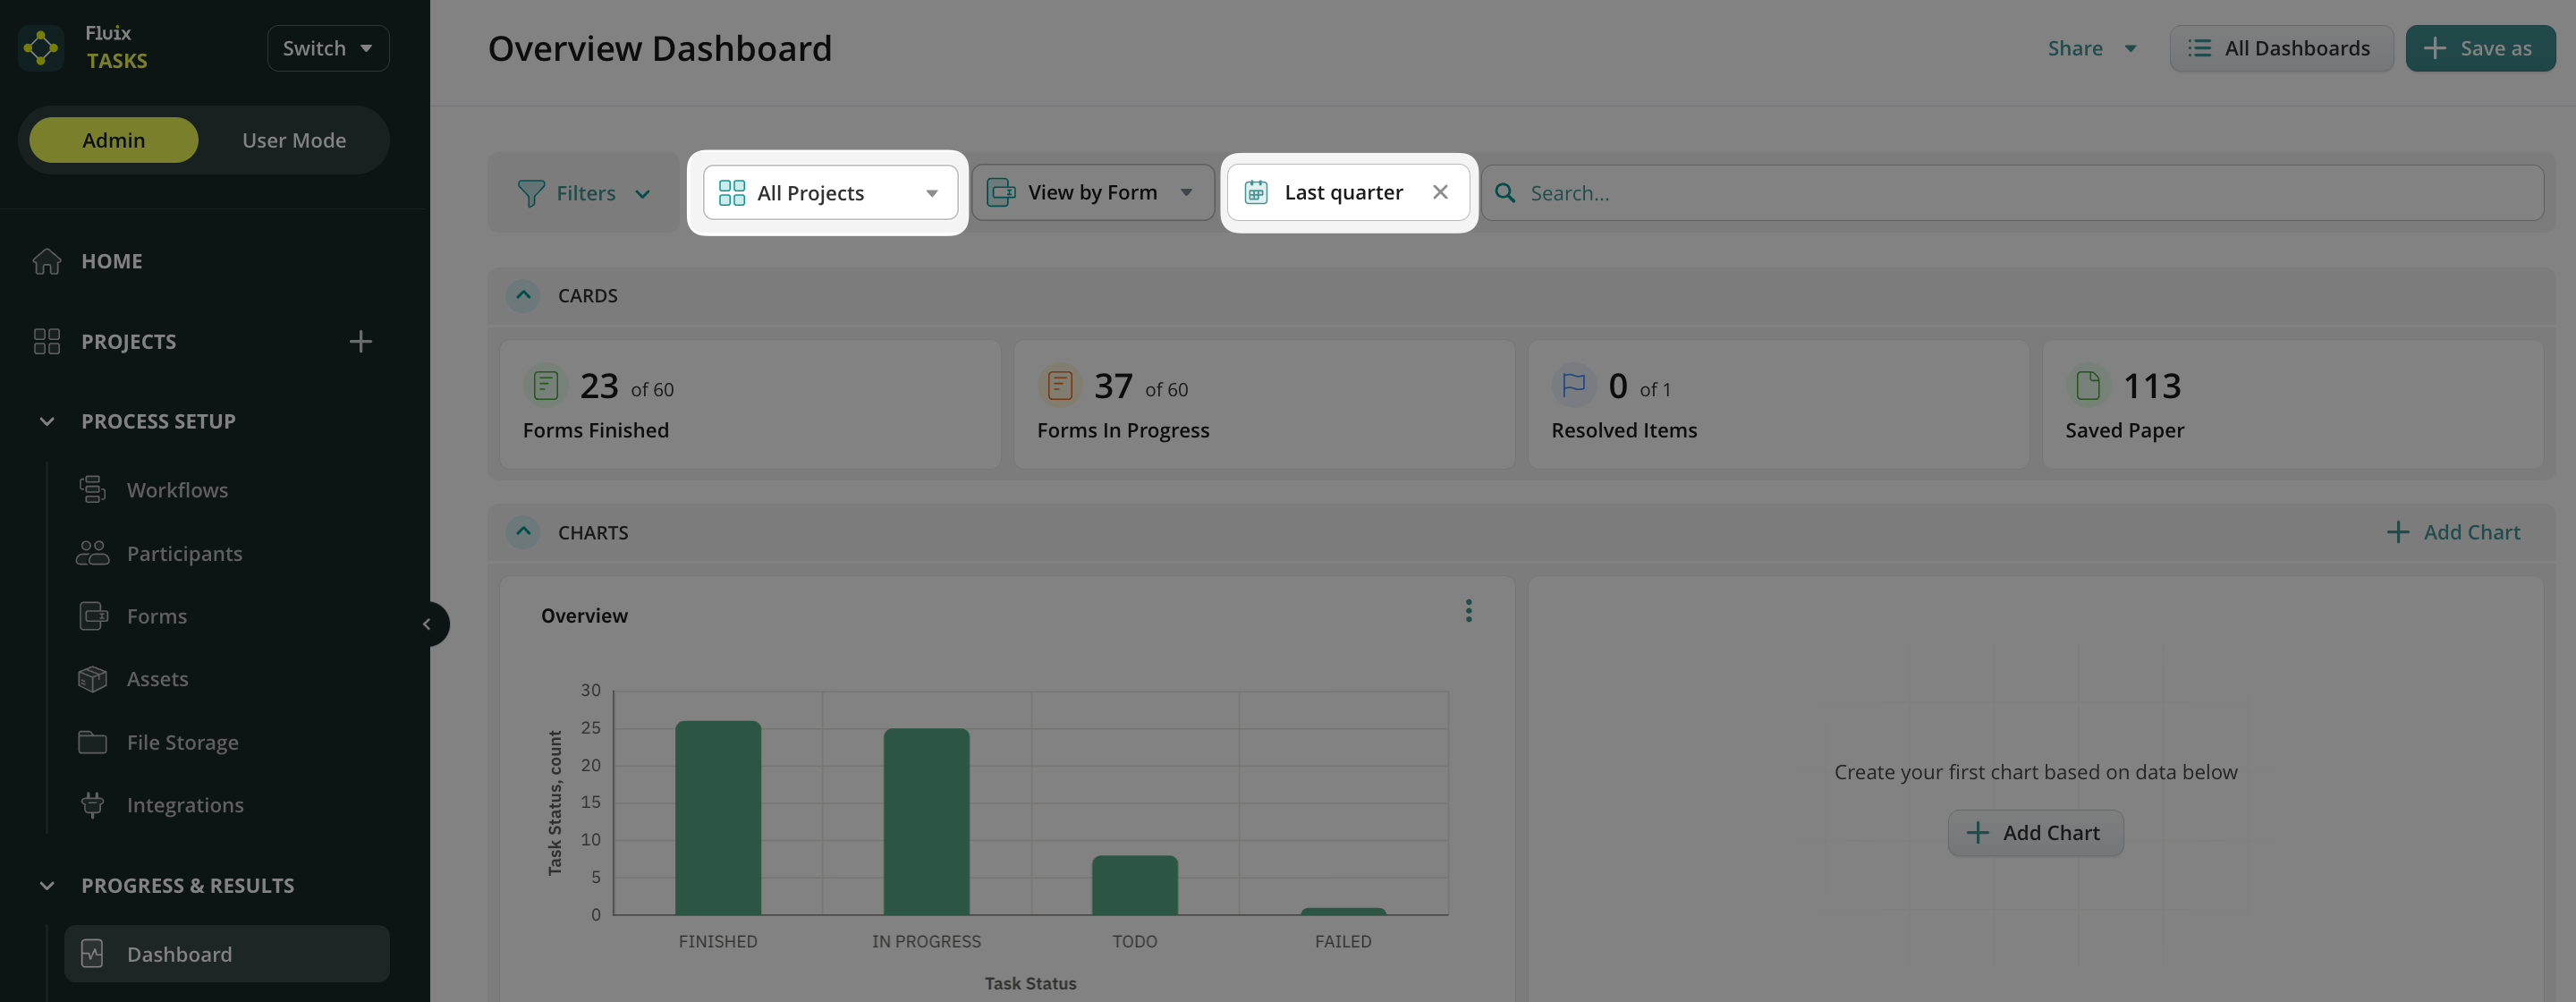
In addition, dashboard data can be further refined by Project and Period.
Project allows you to focus on information associated with a specific project. Select a project from the available list to display only data related to that project.
Period allows you to analyze information within a selected timeframe. Choose a predefined date range or specify a custom period to focus on recent activity or performance during a particular time window.
How to customize data in your Dashboard?
The Dashboard can be customized to display the information most relevant to your business needs. You can tailor the dashboard by adding charts to visualize key metrics and trends, as well as by modifying the data table. Learn more about Charts functionality in this article.
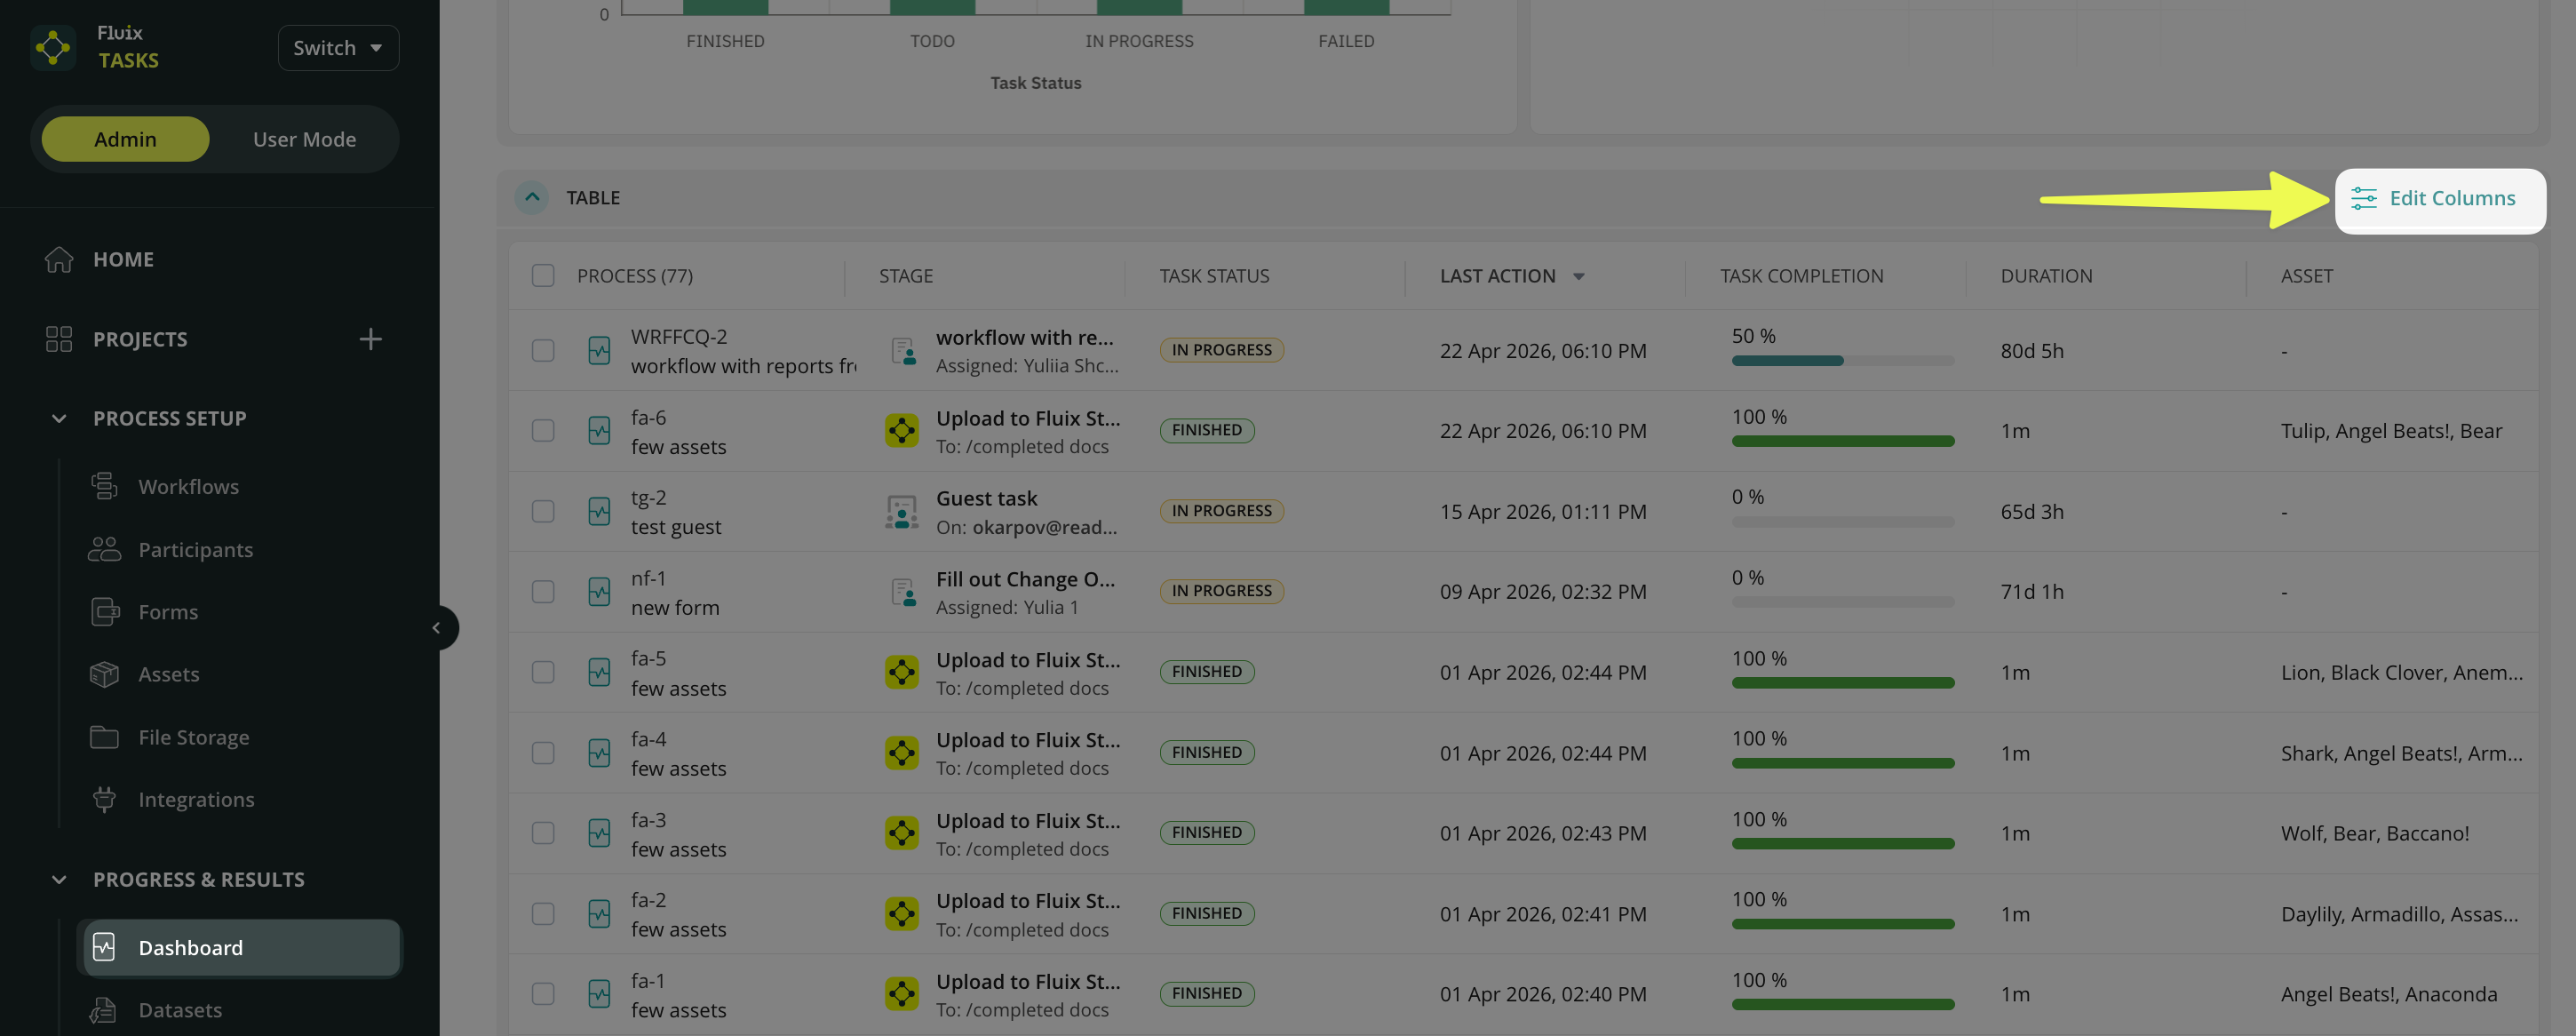
To customize the columns in your Dashboard, click the Edit Columns button. Table customization options include adding new columns, removing existing columns, or replacing columns with different data fields. This flexibility allows you to create dashboard views that support your reporting requirements and provide quick access to the most important information. Learn more about customization in the tutorial “Customizing and Sharing the Report.”
If you have any additional questions about the functionality, contact us at support@fluix.io to learn more.