


Your field data lives in forms, tasks, and reports, but getting a complete picture of operations means jumping between multiple views, manually compiling the data, and losing time before decisions can be made.
With Fluix Dashboards, you can eliminate this. It’s your One Source of Truth for Field Data. You can consolidate field activity data into a centralized reporting hub, ensuring data consistency, maintaining data integrity, and keeping every team aligned on the same data.
In Dashboard, you can also track progress on ongoing work, monitor the site team’s activity, and take action if something is delayed or goes wrong.
What tasks does Dashboard solve?
The primary advantage of this functionality is that it empowers Admins with a project management and reporting tool. Explore a detailed overview of this feature below.
- Identify Patterns & Analyze Incidents. Spot recurring issues, seasonal peaks, or inefficiencies hidden in raw field data. Visualize issue types, frequencies, and severities to prioritize corrective actions before issues escalate.
- Data Compilation and Filtering. Use the Last Action Period picker to quickly search and filter data in your account. This will also help you better understand the status of various projects or tasks your team is involved in, providing an in-depth analysis of overall team performance.
- Real Time Data. Every time a field team submits a form, your dashboard updates automatically. You’ll see a live view of operations as they happen. In addition, you can check the process history, track task completion times, download the forms submitted for the task, troubleshoot, or take action as needed.
- Dedicated Views for Every Team and Project. Save separate dashboards tailored to specific projects, processes, or audiences, so project managers, safety leads, and executives can see exactly what they need, without the noise.
- Visualize Data Captured In The Field. Build dashboards with filtered data from the forms and tasks your field team fills out on site, and instantly visualize it in the Charts.
- Sharing Data with Your Team. Dashboard offers a simple way to share default or customized reports to improve communication with stakeholders, team, & leadership by sharing separate charts for reviews, POCs, and reporting cycles.
- Managing Active Processes and Task Assignments.
- Reassigning Tasks to Other Team Members. Specific tasks within the Templates or In Progress stages can be reassigned to the group responsible for their completion or to an individual within that group. This action is typically taken when a task assigned to a specific user is affected by circumstances that prevent them from completing it (e.g., illness, absence).
- Suspending and Resuming the Process. You can temporarily suspend and resume specific processes for all users as required. These actions may be beneficial when you need to temporarily pause ongoing processes to await final responses or decisions pertaining to deals.
Dashboard overview
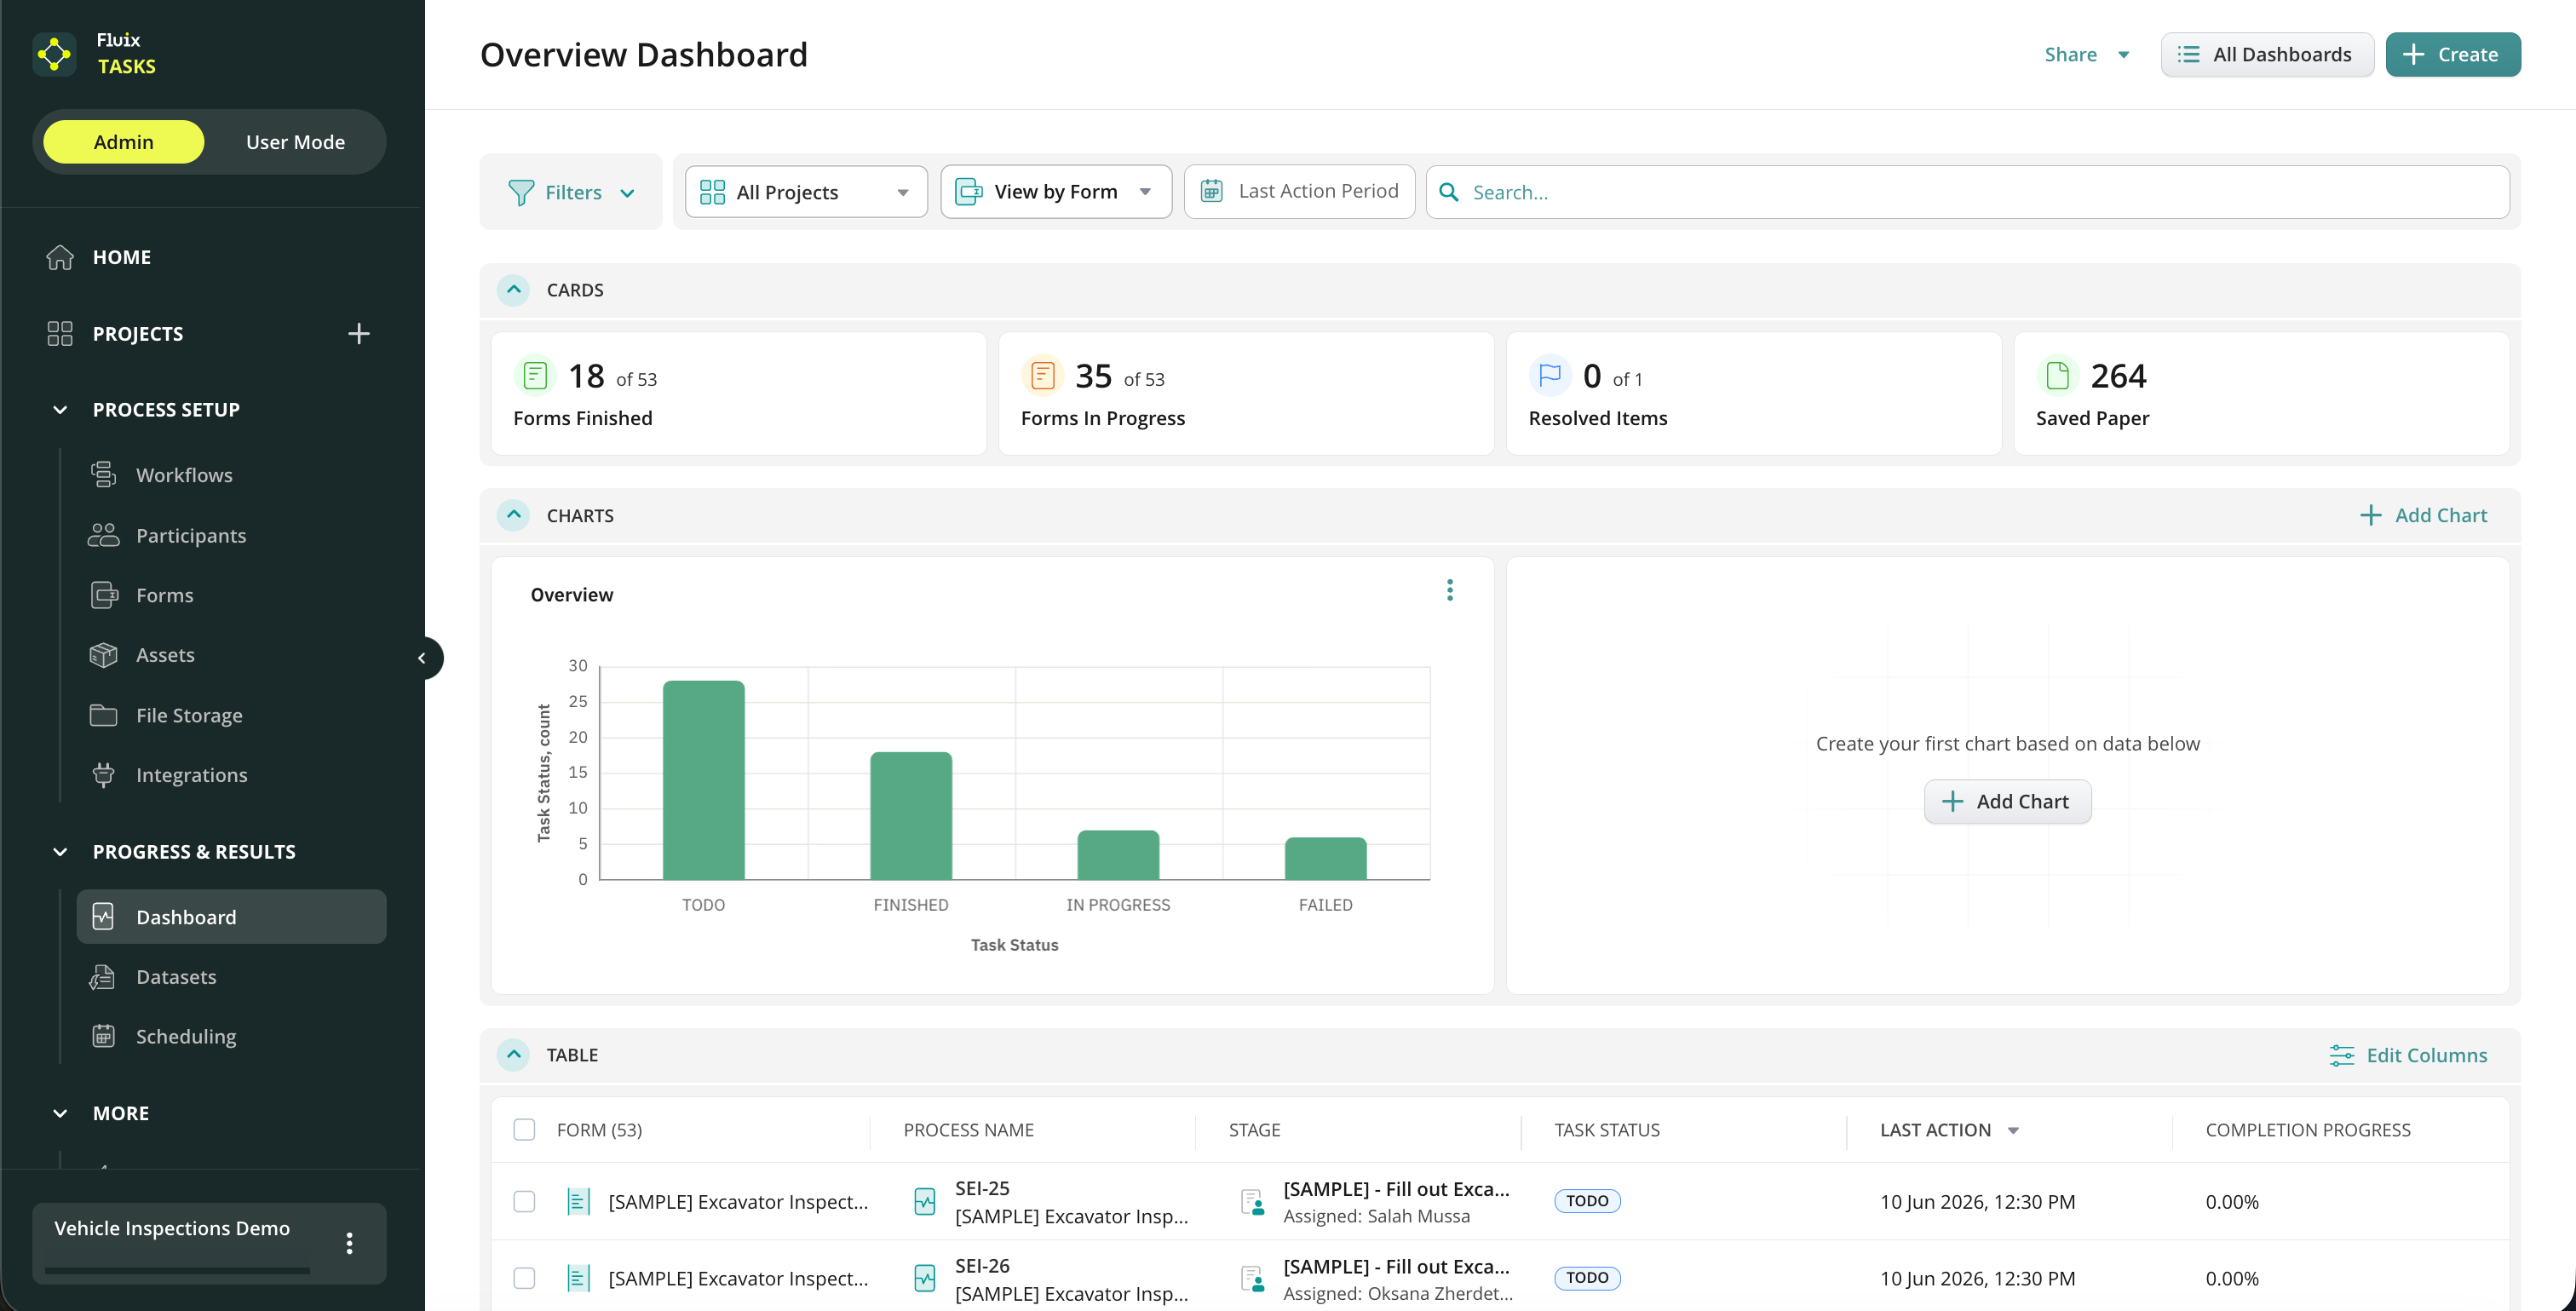
By default, the Dashboard section shows the current state of your account’s processes. In this scenario, data will be filtered to show processes from all workflows in your account. This section contains the following information by default:
- Process. The process ID and the name of the Workflow where this process was initially started. The ID contains the first letters of the Workflow name and numbers.
- Stage. The name of the form’s current task and assignee information (group/user name/guest name).
- Task Status. The status of the current tasks from the process (in case there are parallel tasks, a few statuses will be displayed at the same time):
- ToDo. The task was assigned to a group and is not in progress.
- In Progress. One of the users from the group took the task.
- Finished. All tasks from the Workflow were finished.
- Failed. One of the service tasks has failed (upload to folder/send by email).
- Overdue. The Due time has expired.
- Suspended. The Admin temporarily paused the process. In such cases, the tasks disappear from users’ User app and reappear when the Admin resumes the process by selecting them and clicking the “Resume” button in the Dashboard section.
- Last Action. The latest time when there was any action on the chosen task.
- Completion Progress. The indicator, in percentages, to easily track completion progress within the form.
Customizing Dashboard
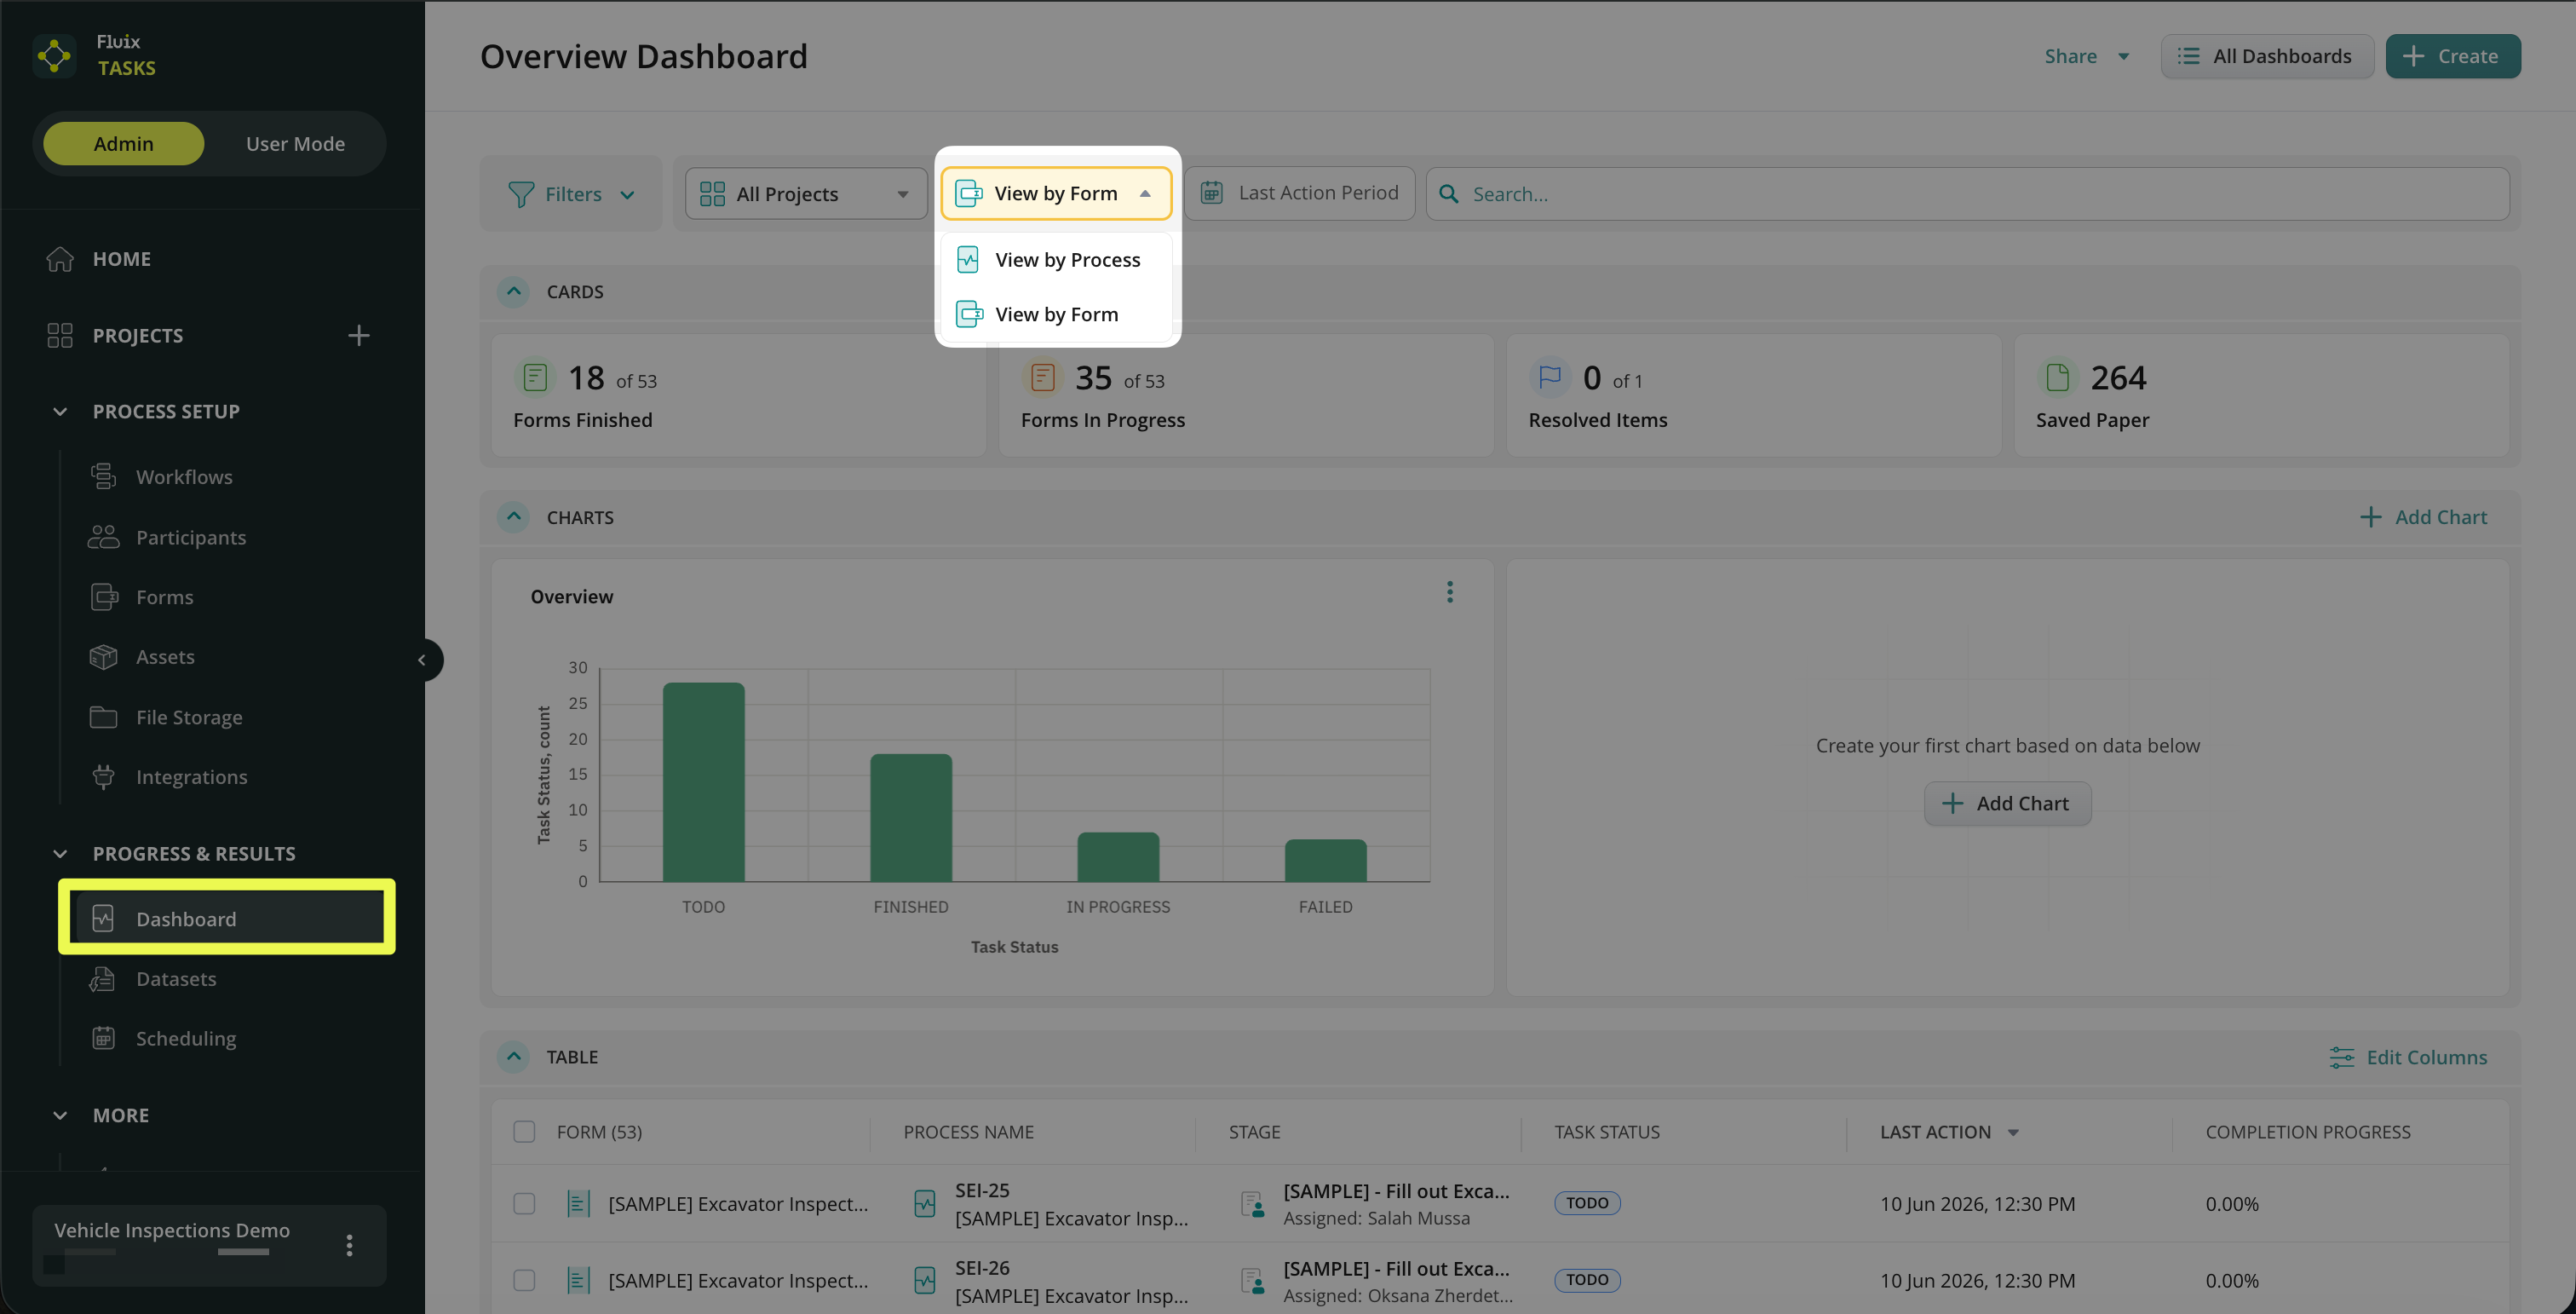
You may customize the Dashboard view by adding specific columns and deleting unnecessary ones. For example, you may change the view type of the data in the Dashboard by:
- By Process – to check the data based on the whole process that your team is working on;
- By Form – to track actions done with the form configured in the respective workflow. It also gives you an additional angle of view to monitor progress on forms and identify bottlenecks or other issues in a timely manner.
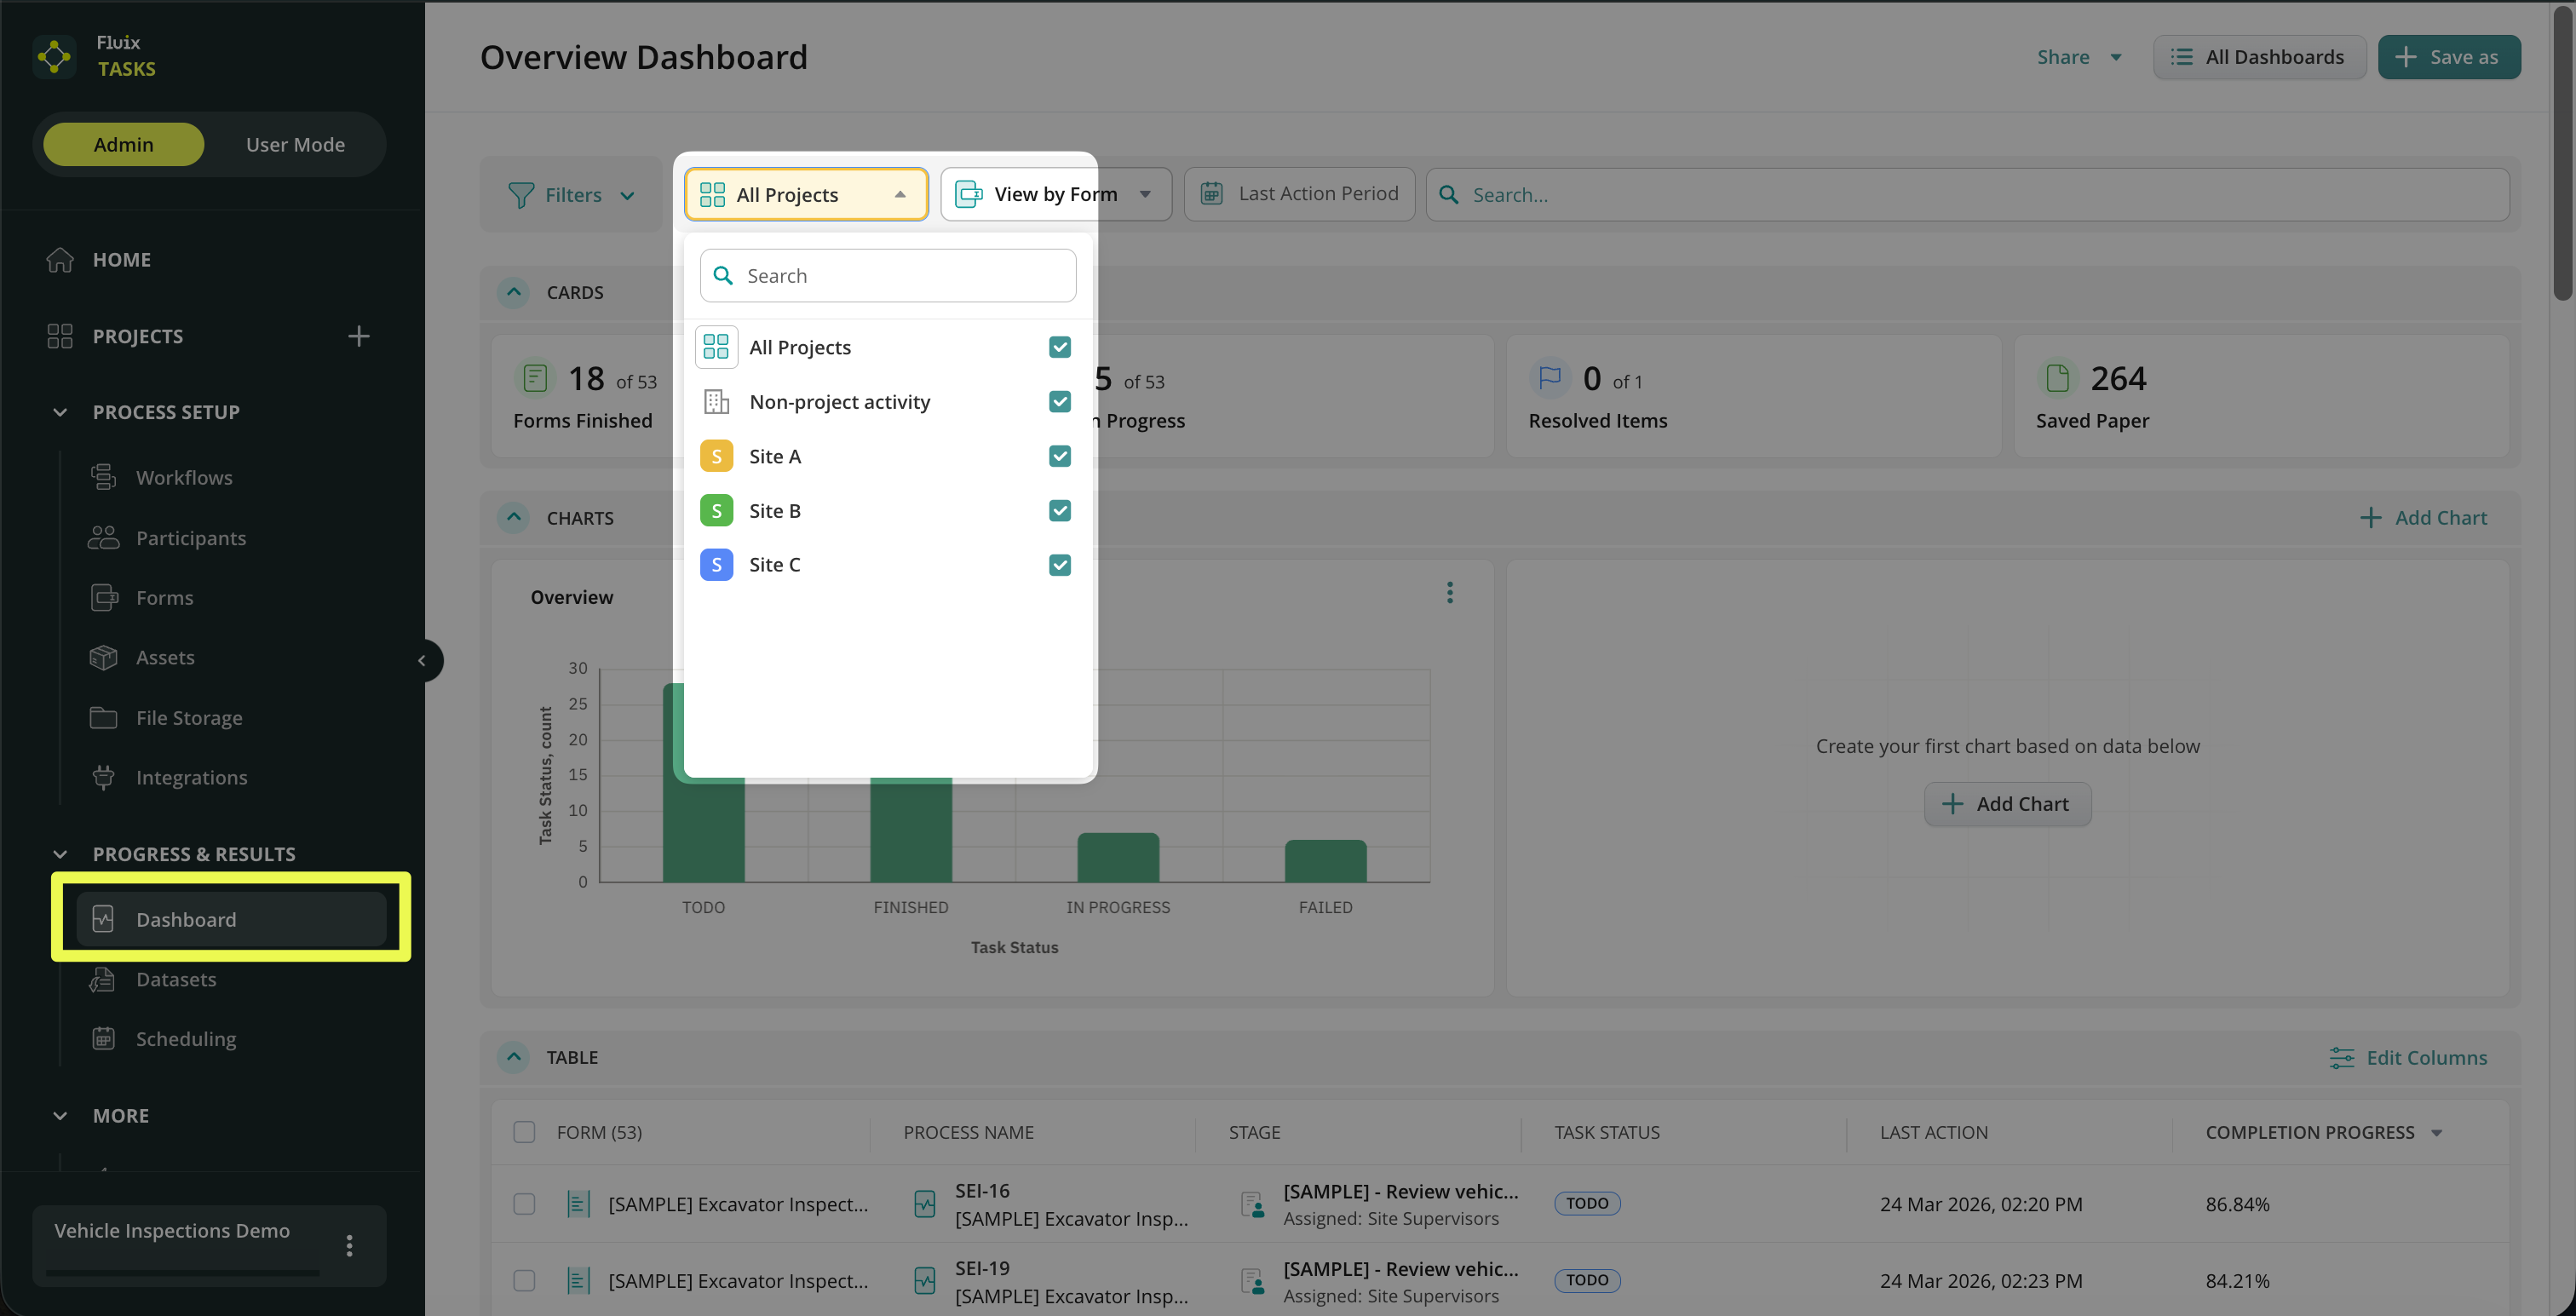
You can also choose which Projects should display data on your main Dashboard.
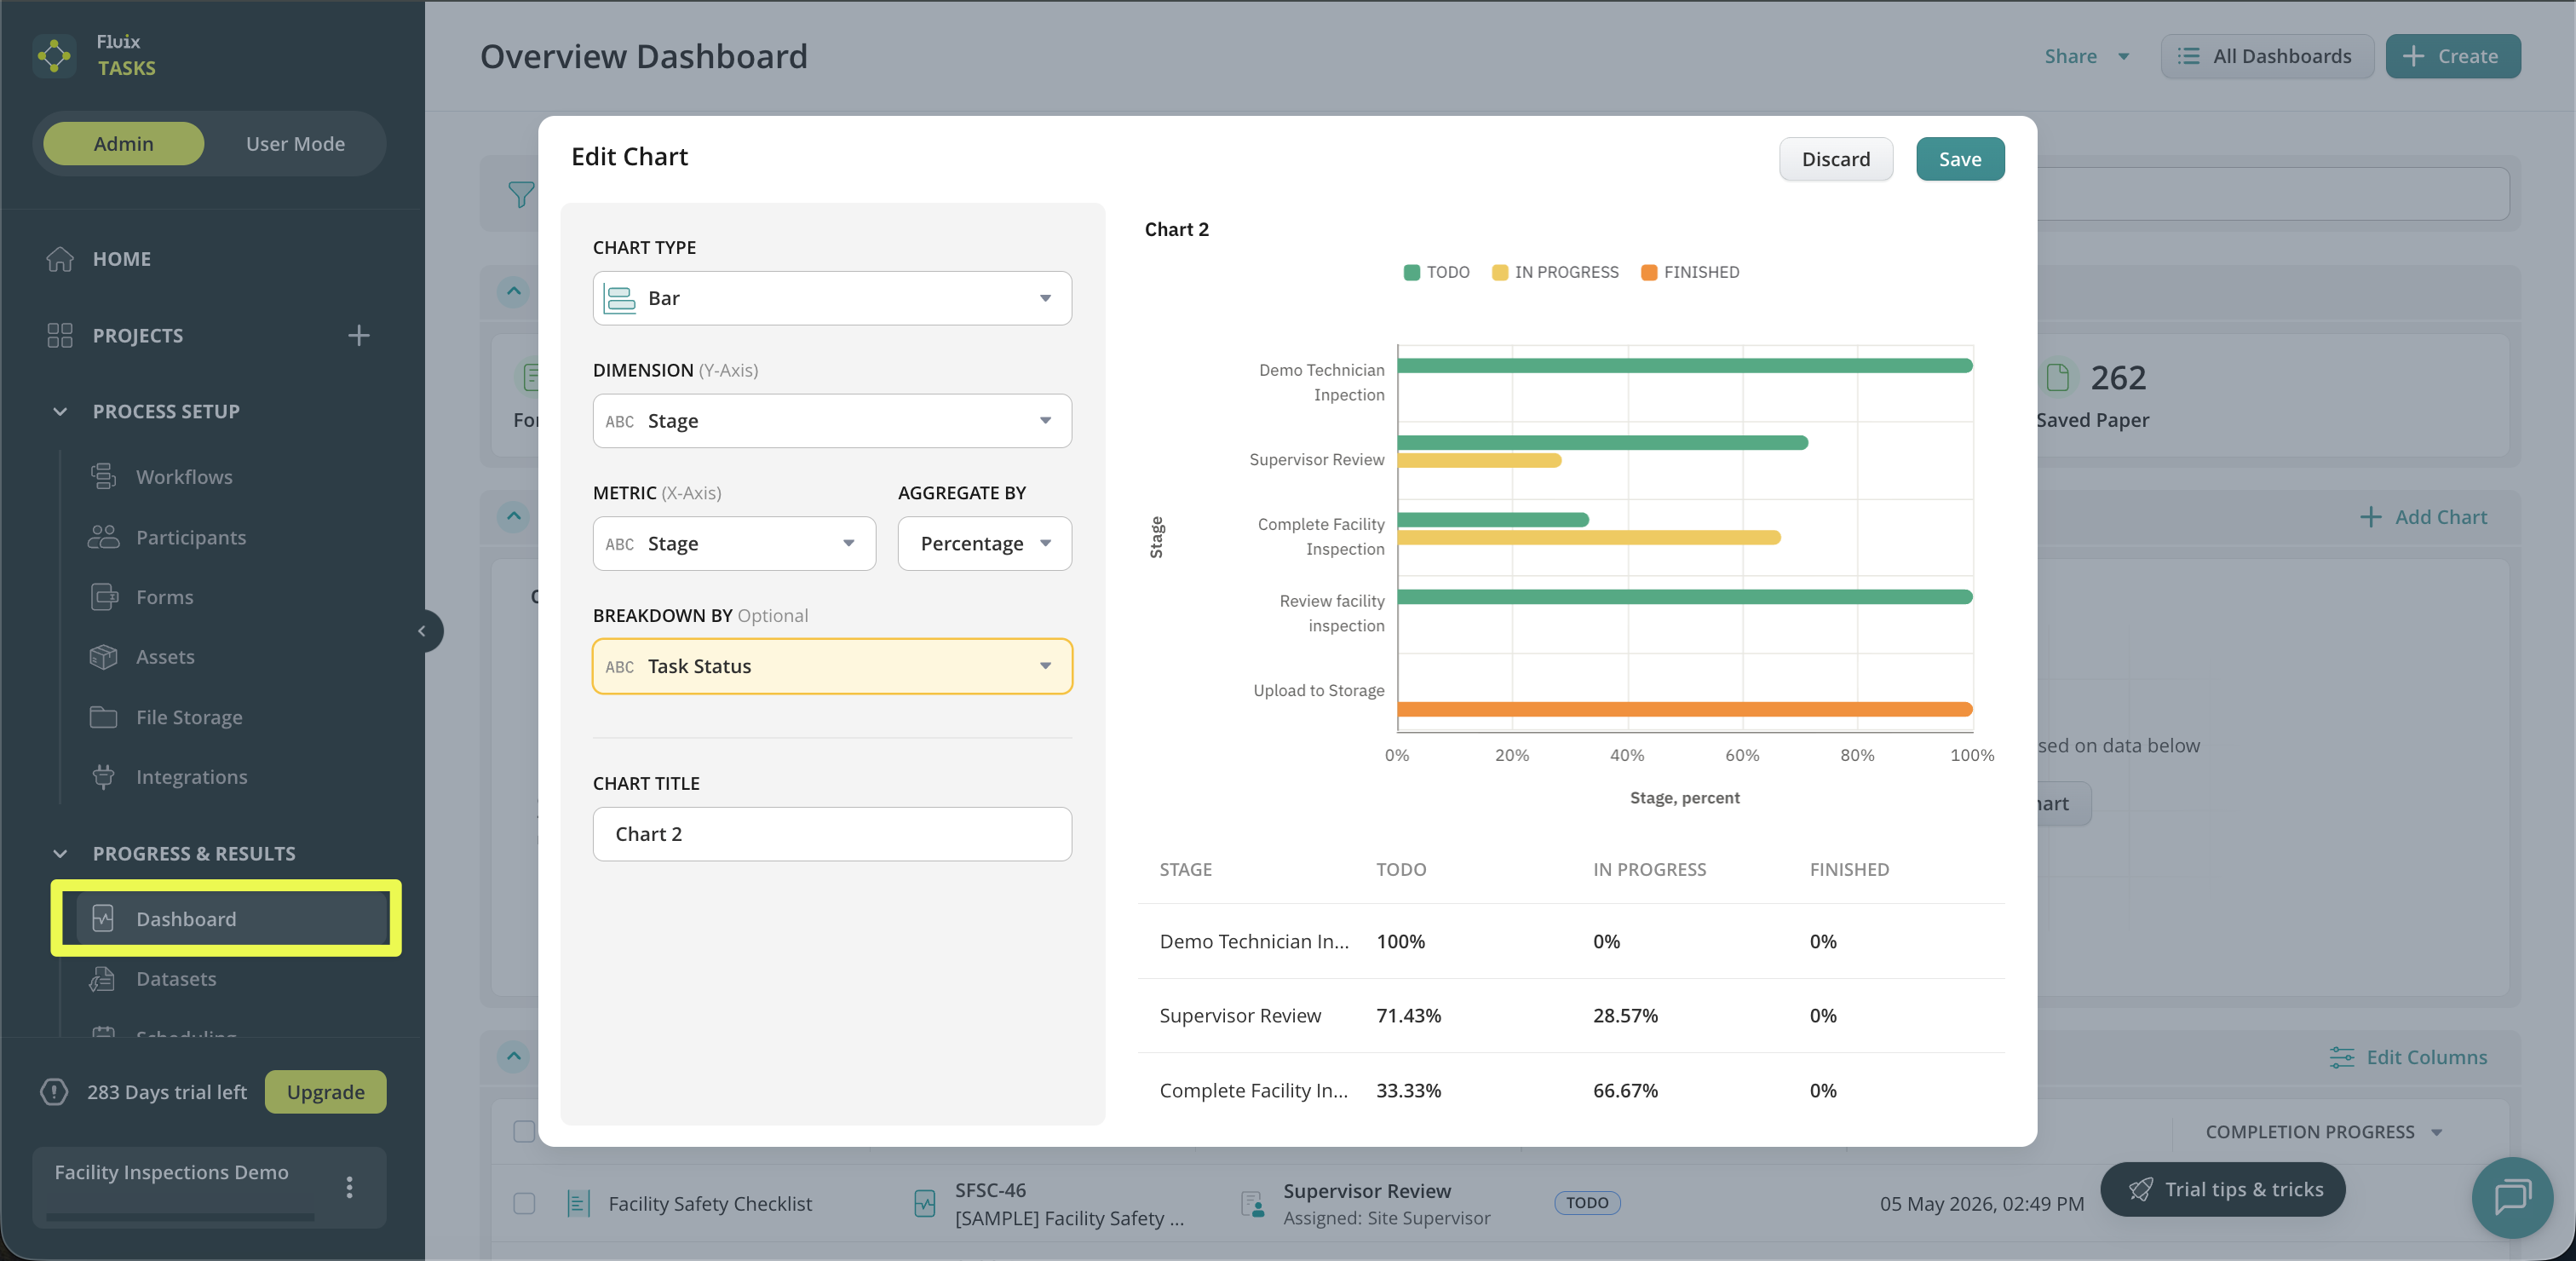
With Charts on Dashboard, you can visualize team performance and make data-driven decisions more efficiently, all without manually analyzing spreadsheets or reports. You can learn more about Charts’ capabilities in Dashboard in this tutorial.
If you have any additional questions about the functionality, contact us at support@fluix.io to learn more.