
The big number of companies prefer collecting field data for further export into an Excel spreadsheet in order to perform manual analysis afterward. Though there is a much more advanced and efficient method to benefit from the data collected into the Fluix datasets – by connecting Fluix to the data visualization platform. One of such platforms is Power BI.
Power BI is a market-leading data processing and visualization tool that helps to uncover meaningful insights of your current workflow using the data collected by your field team. You can utilize colorful and comprehensible graphs, histograms, and other visualization tools in Power BI to process your field data and get a wide picture of the current conditions and requirements of the different aspects of your business.
Use case examples
Besides saved time and eliminated manual effort, automatically aggregated and structured data can benefit in many processes, such as:
- Ability to check what is going on on-site
- Ability for local sites to immediately identify and fix issues
- Access to granular data, for analyzing and comparing multiple sites in the field
- Ability to identify trends to optimize efficiency
- Resource planning
- Revealing hidden bottlenecks, defects, and missing information
- Reporting for compliance with regulations (e.g. OSHA).
Before you start
The first step would be setting up the automated data extraction from the completed forms into the Fluix datasets. Here you can check how to configure them in Fluix. Please note that the feature is available starting from the Core plan. Another point to mention is the Power BI license you will need to acquire.
If you don’t have Fluix account yet, you can register a free trial.
Collect and act on accurate data
See how Fluix can work for you.
How the integration works
Once you connect your Power BI account to Fluix, the data will be automatically pulled from forms that are completed by your team in the Fluix app into datasets into Power BI in real time. There you will see insightful visualizations, filters, and process data based on your requirements with the powerful features of Power BI.
How to connect Fluix to Power BI and start pulling data
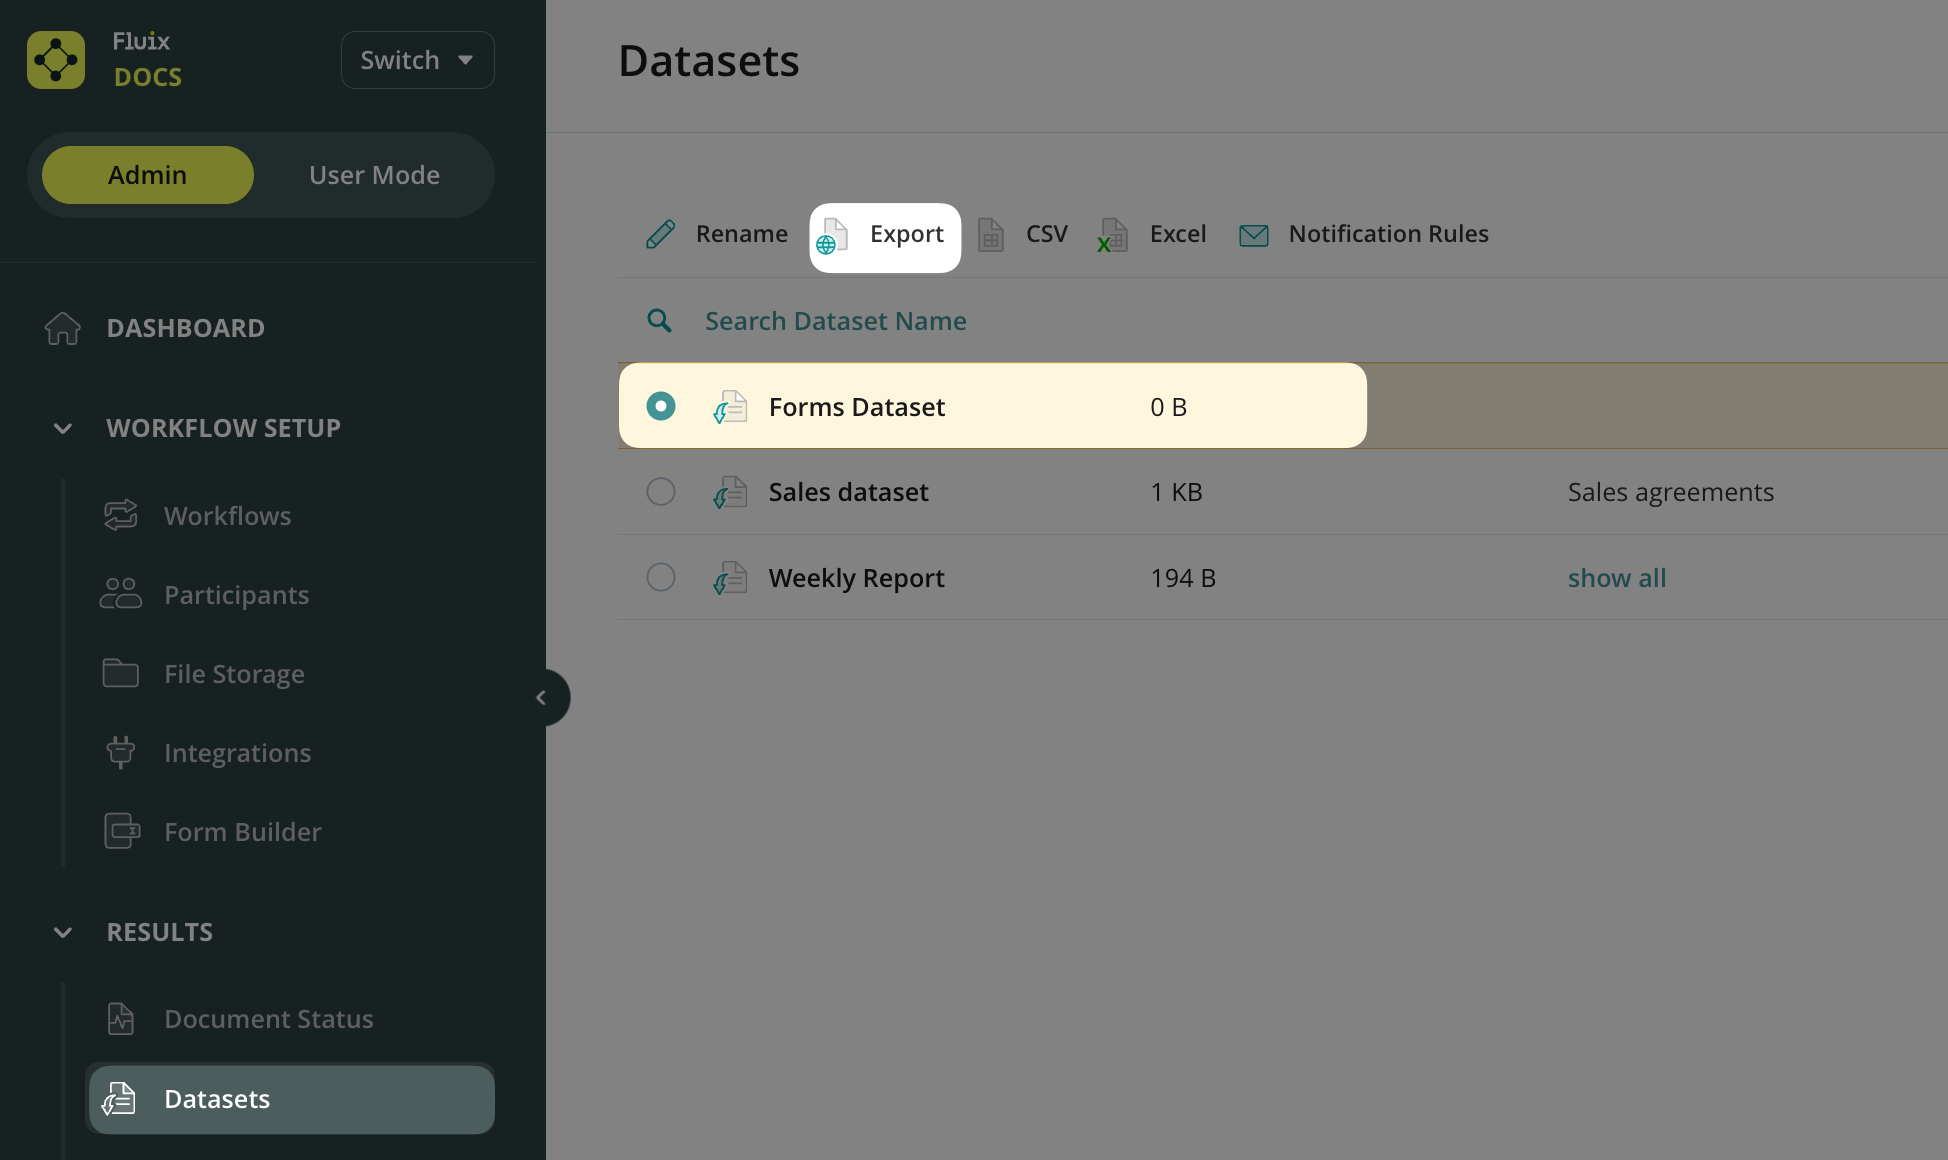
1. In the Fluix admin portal, navigate to Results section, Datasets tab. Select a dataset or subset in Fluix, and click on the Export button (in case you selected subset, click Export button and link to PowerBI)
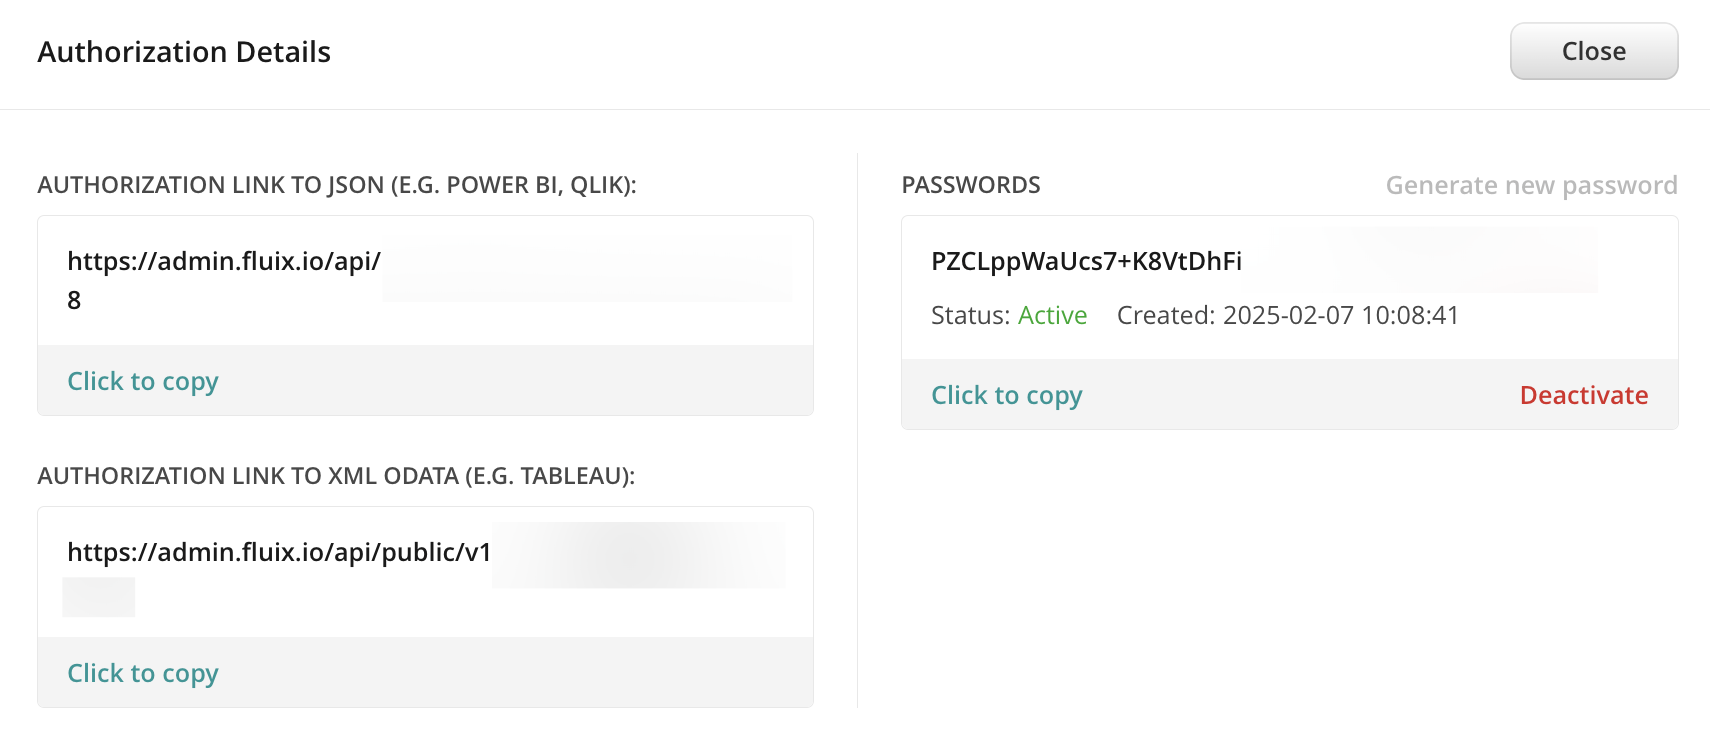
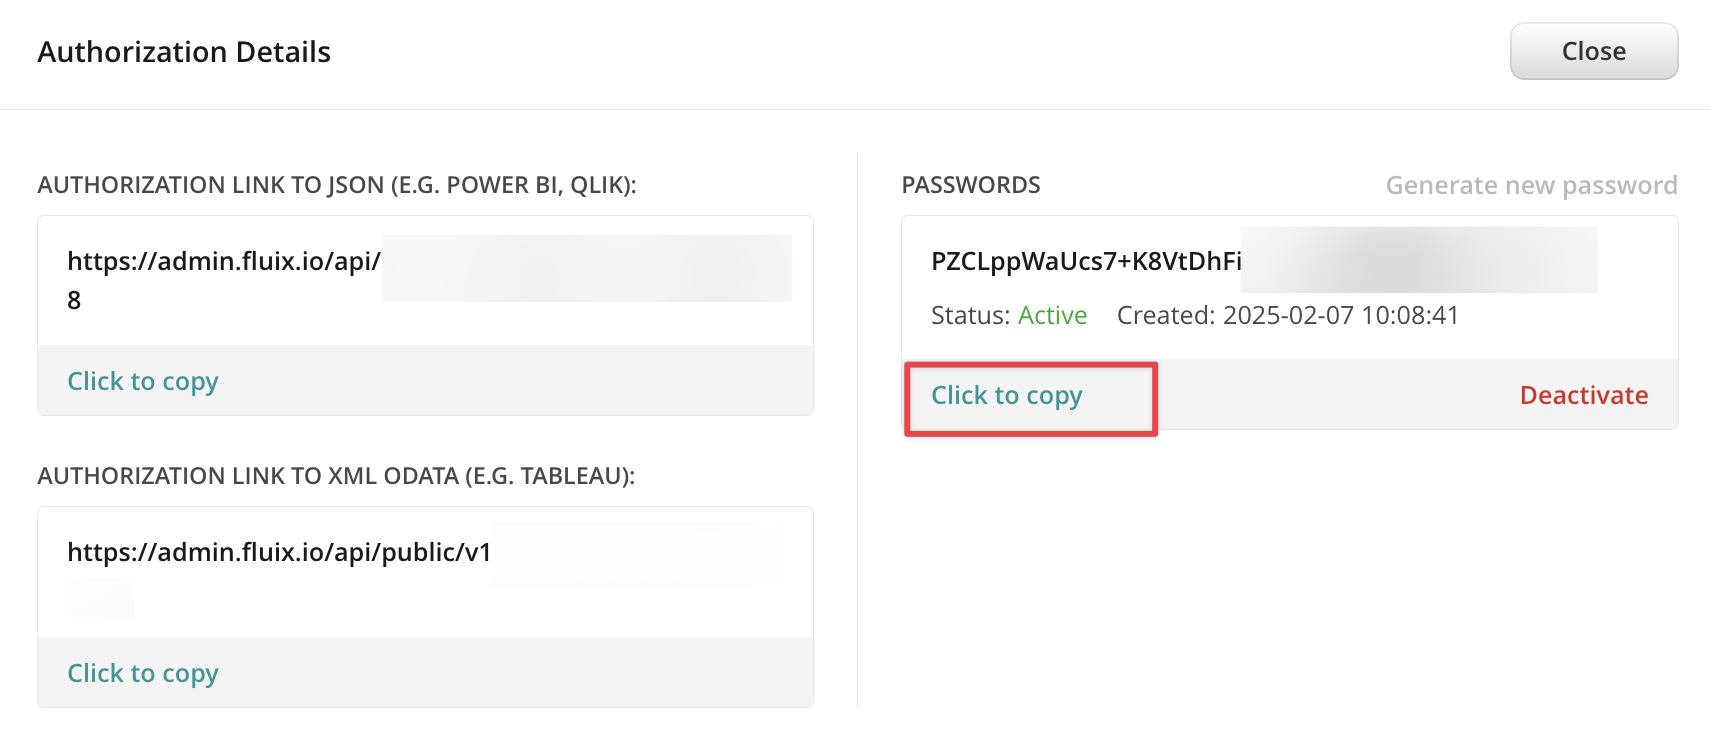
2. Copy the authorization link and password.
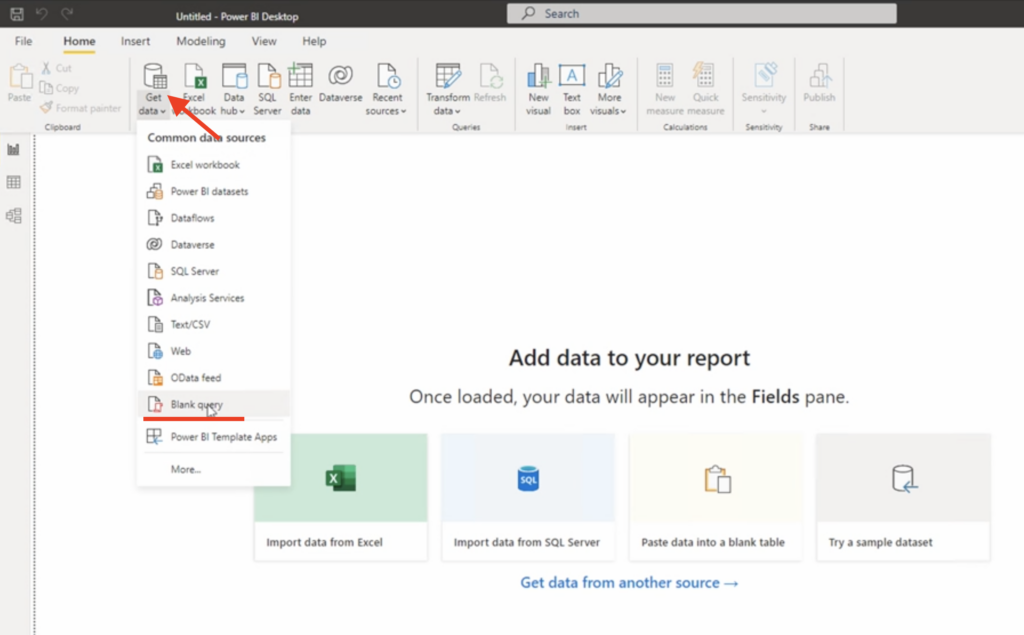
3. Open Power BI, click Get Data, and select Blank Query.
4. In the left menu click the right button on Query 1 and select Advanced Editor.
5. In the opened window paste the code below:
let
    datasetUrl = "{{ export url from admin portal }}",
    getData = (url as text) =>
        let
            source = Web.Contents(url),
            json = Json.Document(source)
        in
            json
    ,
    data = List.Generate(
        () => [hasNext = true, result = getData(datasetUrl)],
        each [hasNext] <> false,
        each [
            result = getData([result][nextUrl]),
            hasNext = [result][hasNext]
        ],
        each [result][collection]
    )
in
    data
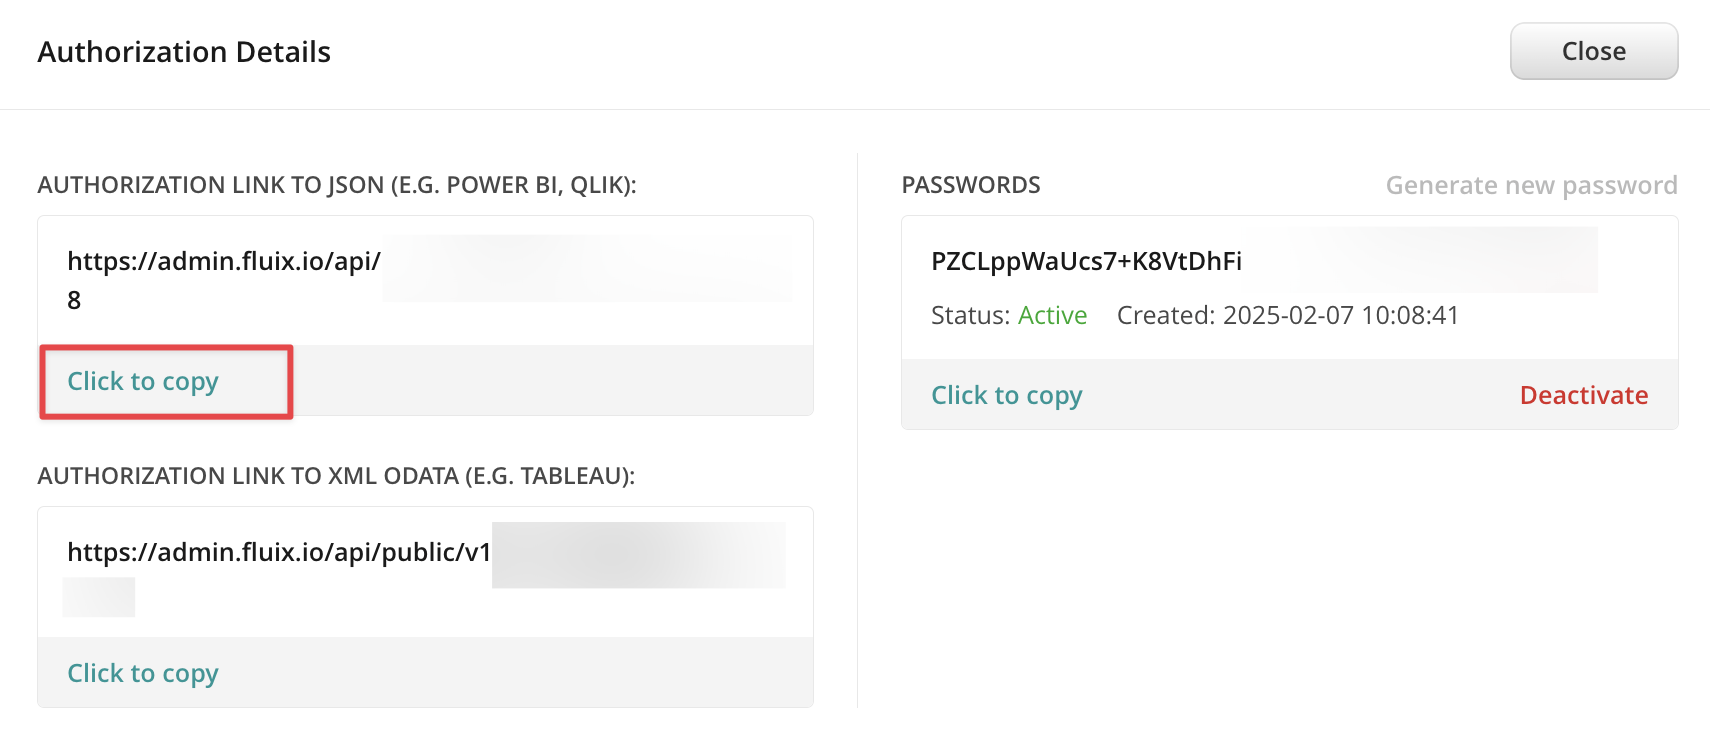
6. Replace {{ export url from admin portal }} with the authorization link copied from Fluix.
7. Click Done.
8. In the line Please specify how to connect: click on Edit credentials.
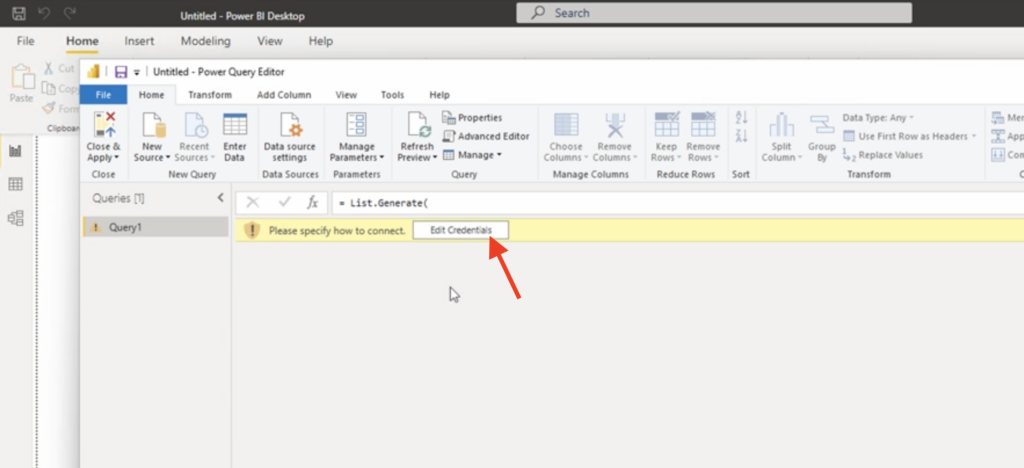
9. In the opened window, in Anonymus section select which level to apply these settings to – select the authorization link you used above.
10. In the Basic section, enter the password copied from the authorization details, and click Connect.
11. Click To Table as on the screenshot below.
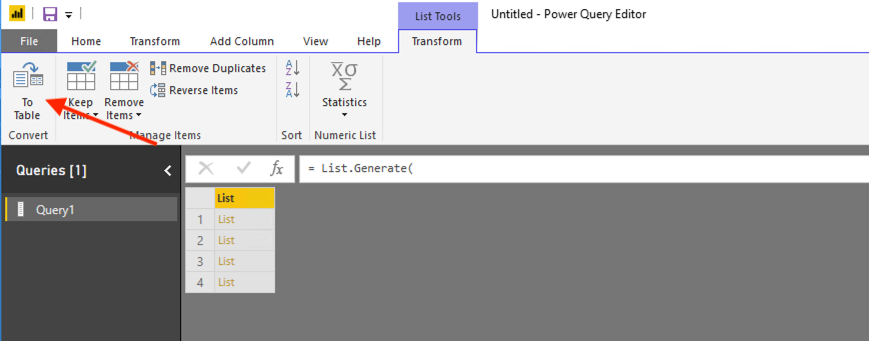
12. In the appeared window just click OK
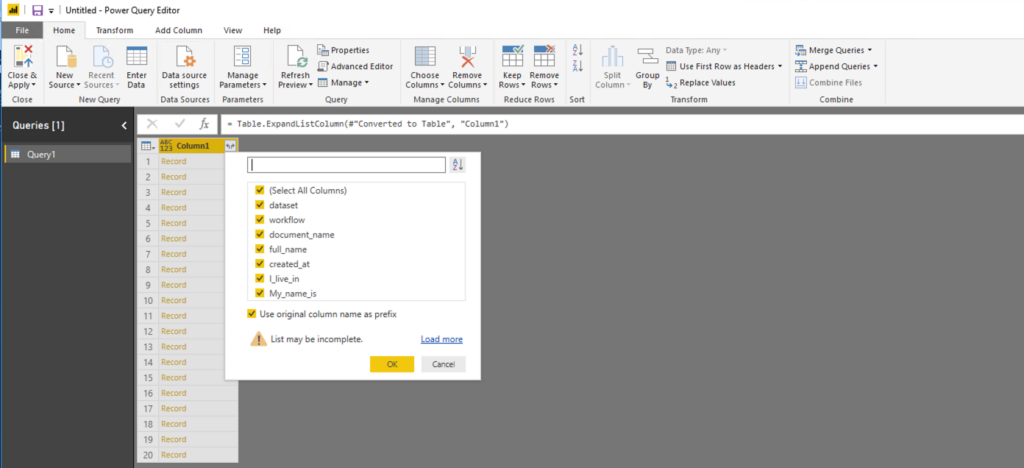
13. After that you’ll see Column1 where you’ll need to click Expand to new rows:

14. Click again on Column1 and select the fields you need and click OK:
In case you have any questions or difficulties with setup, contact our support at support@fluix.io, and we’ll be happy to help you.
Check other Fluix integrations here.