


Making sense of data collected in the field is still one of the biggest challenges faced by most businesses. The solution might be found in data intelligence tools that provide data visualization options to help companies analyze trends and make data-driven decisions. A good question is how to connect tools that collect field data with the tools that analyze it.
We are excited to make this process easier for you and your team by introducing our latest integration – Fluix and Airtable.
What is Airtable?
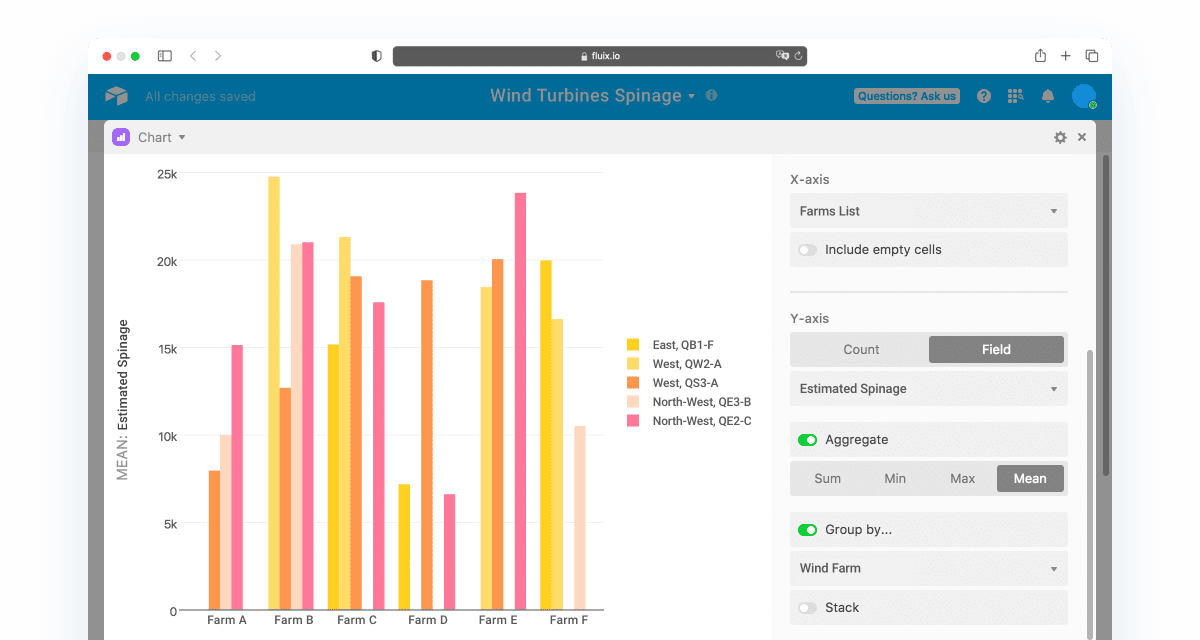
Airtable is a cloud collaboration service that provides an alternative to spreadsheets, allowing people to quickly and easily set up databases to make sense of the data they want. With the help of this integration you will be able to:
- Transform your data into progress bars, pie charts, and histograms that the entire team can easily understand and interpret.
- Turn words and numbers into actionable, meaningful insights that will help you to make data-driven decisions.
- Monitor work progress, identify trends, spot productivity pitfalls. Find ways to improve your workflows by automating time-consuming, manual tasks.
Connecting Fluix and Airtable takes just 30 minutes and doesn’t require coding. Ready to start?
Want Fluix to integrate with another tool of your choice? Reply to this email and tell us the name of the tool you need to connect!